Download
1 / 21
210 likes | 232 Vues
A collaborative project focusing on validating surface temperature and vegetation products with surface flux applications using data from the Chequamegon Ecosystem Atmosphere Study. The study aims to quantify carbon, water, and energy exchange in cold-temperate forest ecosystems. Data collection, scaling processes, and communication strategies are outlined, along with plans for 2001 field campaigns. Communication of results will include submissions to Global Change Biology journal. Collaborative opportunities with NASA EOS-VAL are sought.

E N D
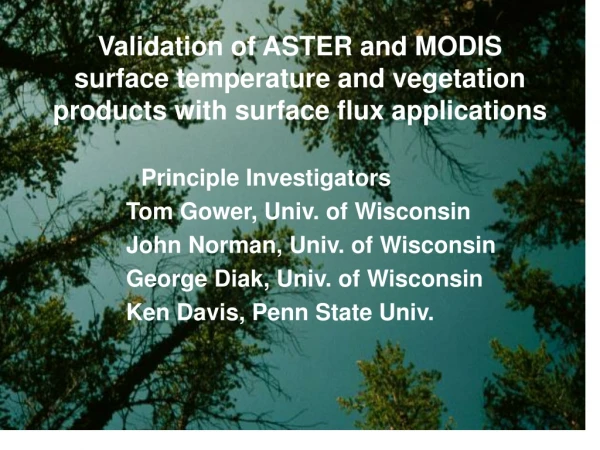
Validation of ASTER and MODIS surface temperature and vegetation products with surface flux applications Principle Investigators Tom Gower, Univ. of Wisconsin John Norman, Univ. of Wisconsin George Diak, Univ. of Wisconsin Ken Davis, Penn State Univ.
Outline • General Project Background • Objectives and Products to be Validated • Data Collected and Results • Data Availability and Collaboration • Scaling from Plots to MODIS Pixels to Flux Tower Footprints • Communication of Results • YR 2001 Plans
Chequamegon Ecosystem Atmosphere Study (CHEAS) WLEF Tower 450 m • Multi-disciplinary, collaborative program to quantify carbon, water, • and energy exchange between cold-temperate forest/wetland landscape • and the atmosphere. • Located in northern Wisconsin, near Park Falls, WI. • Dominant ecosystems are: alder wetlands, early successional aspen forests, northern hardwoods, and upland pine forests. • Funding sources are: NASA EOS-VAL, DOE, McIntire-Stennis, NOAA, NASA Hydrology, TECO.
25 km2 tower footprint flux tower flux tower 12 Plots will be sampled at three levels of intensity: 10 3rdorder plot:land cover, LAI, and fAPAR 1 2 9 4 2nd order plot: above + (NPPA) 3 8 6 5 7 11 1 km2 1st order plot; above + (NPPB) CHEAS Cyclical Sampling Design
CHEAS Experimental Design WLEF tall tower (450 m eddy flux tower) Traditional eddy flux towers - hardwoods - alder/cedar
Dominant Vegetation Types • alder wetland • upland pine • aspen • northern hardwoods
II. Products to be measured and Validated • Land surface temperature (LST) and emissivity at the scale of ASTER and MODIS pixels • Leaf Area Index (LAI) • Fraction Intercepted Photosynthetic Active Radiation (FIPAR) • Aboveground and Total Net Primary Production (NPPA and NPPT) • Net Ecosystem Production (NEP)
Validation of MODIS Products GPP • Products • Landcover 1,2 • LAI 1,2 • fIPAR 1,2 • NPP 1,2 • GPP 1,3,4 • NEP 1,3,4 • 1 = MODIS • 2 = field measure • 3 = simulated (IBIS) • 4 = eddy flux RA NPP RH RROOTS GPP = Gross Primary Production NPP = Net primary Production NEP = Net Ecosystem Production RH = Heterotrophic Respiration RA = Autotrophic Respiration
Calibration of Differential Infrared Thermometer (DIT) to be used to Validate Aster Vegetation Temperature Product 35 ambient T= 20 C ambient T= 30 C 30 Surface T by DIT, C 25 20 15 15 20 25 30 35 Surface T, C Everest Interscience Infrared thermometer (model 4000) - measured in 8 - 14 m wavelength bands ASTER surface temperature channels are 10.25-10.95 and 10.95-11.65 m * Atmospheric Emitted Radiation Interferometer (AERI) emissivity measurements to be compared to the five ASTER thermal bands
Inter-annual variation in LAI Burrows et al. , in prep.
Comparison of Measured (Eddy flux) vs Simulated (IBIS) Net Ecosystem Production Simulated (IBIS) NEP (kgC m-2 d-1) Eddy flux NEP (kgC m-2 d-1)
IV. Data Availability and Collaboration • All 1999 and 2000 data have been submitted to Mercury • All 1999 and 2000 data are available from the CHEAS webpage:www.cheas.umn.edu • We are anxious to collaborate with MODLAND and other scientists. All that we ask is that users of the data contact appropriate PI for any revisions.
V. Scaling from plots to MODIS pixels to flux tower footprints • Process-based ecosystem models driven by remotely sensed vegetation cover, LAI, and fIPAR Atlas, ETM+, MODIS • Geostatistical models • avoids saturation problems • quantitative approach to estimate biomass
MODIS w/ Biome 6 NDVI/LAI algorithm MODIS LAI Co-Kriged Comparison of MODIS LAI to Field Measurements
VI. Communication of Results • Global Change Biology special issue for the CHEAS project – manuscript deadline is Feb 1, 20001. • There is interest within the NASA EOS-VAL science team to contribute to a special MODIS issue??
Field Plans for 2001 1. Measure LAI and fIPAR - 1 major field campaign during peak LAI - 2 minor field campaigns to capture phenology 2. Measure ANPP 3. Image Acquisitions - MODIS, ETM+, AVIRIS, ATLAS? 4. Comparison of NPP, GPP and NEP among MODIS products, IBIS ecosystem model, and eddy flux tower