FY02 ASA Presentation Provide Facility Management and Maintenance Services
620 likes | 792 Vues
FY02 ASA Presentation Provide Facility Management and Maintenance Services. Presented by: Kelvin Lawson John Dattoli Herb Jacobi Team Members: Richard Allen, Jim Bullman, John Dattoli,Jeff Fellows, Herb Jacobi, Frankie Kelly, Kelvin Lawson, William Monath, Bradley Provancha, James Wilson

FY02 ASA Presentation Provide Facility Management and Maintenance Services
E N D
Presentation Transcript
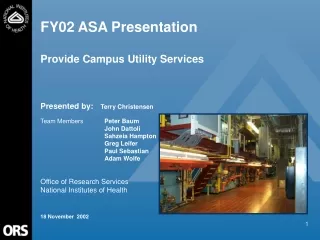
FY02 ASA Presentation Provide Facility Management and Maintenance Services Presented by: Kelvin Lawson John Dattoli Herb Jacobi Team Members: Richard Allen, Jim Bullman, John Dattoli,Jeff Fellows, Herb Jacobi, Frankie Kelly, Kelvin Lawson, William Monath, Bradley Provancha, James Wilson Office of Research Services National Institutes of Health 18 November 2002 Provide Facility Management and Maintenance Services
Table of Contents Main Presentation ASA Template ……………………………….………………………………..4 Customer Perspective……………………….………………………………..5 Customer Segmentation …………………….……………………………………..7 Customer Satisfaction……………………….……………………………………...9 Customer Satisfaction Additional Measures……………………………………10 Unique Customer Objectives and Measures.…………………………………..12 Internal Business Process Perspective……………………………………14 Service Group Block Diagram……………………………………………………15 Conclusions from Discrete Services Deployment Flowcharts………………...16 Process Measures………………………………………………………………...17 Learning and Growth Perspective………………………………………….27 Conclusions from Turnover, Sick Leave, Awards, EEO/ER/ADR Data……...28 Analysis of Readiness Conclusions……………………………………………..29 Financial Perspective………………………………………………………..30 Unit Cost……………………………………………………………………………31 Asset Utilization……………………………………………………………………32 Conclusions and Recommendations………………………………………33 Conclusions from FY02 ASA..……………………………………………………34 Recommendations…………………………………………………………………35 Provide Facility Management and Maintenance Services
Table of Contents Appendices Page 2 of your ASA Template Customer segments graphs Customer satisfaction graphs Block diagram Process maps Process measures graphs Learning and Growth graphs Analysis of Readiness Information Unit cost graphs Asset utilization graphs Any unique measures graphs Provide Facility Management and Maintenance Services
Customer Perspective • Customer Objectives • C1. Increase Understanding of the Customer Base • C2. Increase Customer Satisfaction • C3. Increase Access to Automated Maintenance Services System Provide Facility Management and Maintenance Services
Customer Perspective Measures For Customer Objectives Objectives Measures Provide Facility Management and Maintenance Services
C1. Objective: Increase Understanding of the Customer BaseC1.1Measure: Customer Segmentation Chart for DS1-8 Factored SF = 12.76 M Non Factored SF = 9.48 M Factors: Animal = 2.0, Lab = 1.5 Provide Facility Management and Maintenance Services
C1. Objective: Increase Understanding of the Customer BaseC1.1 Measure: Customer Segmentation Chart for DS9 Total = 91773 SF Provide Facility Management and Maintenance Services
Customer Perspective C2. Objective: Increase Customer SatisfactionC2.1 Measures: Customer Survey Methodology for DS1-DS9 • FY 03 Surveys will be conducted for each Discrete Service • Survey Instrument will be the ORS Scorecard Provide Facility Management and Maintenance Services
Customer Perspective C2. Objective: Increase Customer Satisfaction C2.2 Measure: Increase Customer Score on DS5 - Respond to Service Calls Surveys C2.3 Measure: Increase Customer Score on DS3 - Provide Pest Management Control Surveys Provide Facility Management and Maintenance Services
Customer Perspective C2. Objective: Increase Customer Satisfaction C2.2 Measure: Increase Agree Strongly scores on Automated Maintenance System Survey 44% - Strongly Agree Satisfaction Scores are Shown as Actual Percentage of Total Surveys Returned 37% - Agree 8% Neutral 65% - Not Returned 5 % - Disagree 6 % - Disagree Strongly Provide Facility Management and Maintenance Services
Customer Perspective C2. Objective: Increase Customer Satisfaction C2.3 Measure: Increase Satisfactory to Excellent Scores on Pest Management Satisfaction Surveys for Labs FY03 Target to be Determined Provide Facility Management and Maintenance Services
Customer Perspective C3. Objective: Increase Access to Computerized Maintenance Management SystemC3.1. Measure: No. of Service calls submitted via Web Actual = 33% FY 03 Target = 50% Non-Web based calls Web based calls= 33% Avg. Provide Facility Management and Maintenance Services
Internal Business Process Perspective • Internal Business Process Objectives • I1. Increase Understanding of our Processes • I2. Identify methods to measure processes Provide Facility Management and Maintenance Services
Facilities Management and Maintenance Services Block Diagram Provide Facility Management and Maintenance Services
I1. Objective: Increase Understanding of ProcessesI1.1 Measure: Create 9 Process Deployment Flow Charts • Change Name of DS# 7 to “Small Purchase Maintenance Repairs” • Refine and Comply Organizationally to the Workflow SOP’s in the PWB Organization and Operations Manual produced as part of the Central Call Desk initiative • Re-educate all FM’s and Maintenance Personnel on Closing Out tickets • Collapse DS# 7 into DS# 6 “Perform Preventive Maintenance” Analysis and Recommendations Provide Facility Management and Maintenance Services
Internal Business Process Perspective I2. Objective: Identify methods to measure processes I2.2 Measures: 9 Discrete Services • DS1: Manage Facility Operations and Services • Reduce weighted Average Time to Close Out Trouble Calls • DS2: Provide Sanitation Services • Increase % of buildings scoring 90% or higher on inspection • DS3: Provide NIH-wide pest management control • Reduce # of recommendations over 90 days old • DS4: Operate Dynamic Building Systems • Define the sq. footage operated and maintained per Maintenance Staff and compare to industry standards to develop baseline • DS5: Respond to Service Calls • Increase % of service calls received via web • DS6: Perform Preventive Maintenance • % of Electrical Maintenance team PM’s done on time • DS7: Replace Obsolete Building Systems and Components • Reduce the sq footage per Small Purchase Repair $ • DS8: Maintain Public Space • Increase the % of FM public space inspection done on time • DS9: Manage Residential Property • Reduce the # of repeat service calls Provide Facility Management and Maintenance Services
DS1: Manage Facility Operations and ServicesMeasure:Reduce weighted average days for completion time for trouble calls by section Target FY O3 7.0 Days
DS2: Provide Sanitation ServicesMeasure:Increase % of buildings scoring 90% on inspection FY03 Target Mo Avg. = 31 FY02 Actual Mo. Avg. = 28 Provide Facility Management and Maintenance Services
DS3: Provide NIH-wide Pest Management ControlMeasure:Reduce # of recommendations not adopted after 90 days Recommendations Total Recommendations Feb 02 – May 02 Inspection Cycle FY 02 Total > 90 = 115 FY 03 Target = 100 Oct 01 –Jan 02 Inspection Cycle Age of Recommendations Provide Facility Management and Maintenance Services
DS4: Operate Dynamic Building System (FY03 Measure) Measure: Define the sq. footage operated and maintained per Maintenance Staff and compare to industry standards to develop baseline FY 03Target To be developed and compared to industry standards Provide Facility Management and Maintenance Services
DS5: Respond to Service CallsMeasure:Increase % of Trouble calls submitted over the Web Actual = 33% Target = 50% Non-Web based calls Web based calls= 33% Avg. Provide Facility Management and Maintenance Services
DS6: Perform Preventive MaintenanceMeasure:Reduce% of Electrical PM Failures Target: Reduce Failure Rate to 7 % Provide Facility Management and Maintenance Services
DS7: Replace Obsolete Building Systems and Components(FY03 Measure)Measure: Reduce Percentage of PM generated Small Purchase and Repair Work Items that are Incomplete Recommendation: DS7 be folded into DS6 – Perform Preventive Maintenance. This measure would be retained as a second measure for DS6 Provide Facility Management and Maintenance Services
DS8:Maintain Public Space (New Measure For FY 03)Measure:Equal or Exceed SLA % of square footage inspected by FM’s via an Established PM Program in CMMS Notional Provide Facility Management and Maintenance Services
DS9:Manage Residential PropertyMeasure:New FY03 – Improve Service Call Completion Cycle Total # of Service Calls Per Bldg. This chart shows the distribution of FY02 calls. The Measure will show the avg. time to close out service calls on residential property. Provide Facility Management and Maintenance Services
Learning and Growth Perspective • Learning and Growth Objectives • L1. Enhance Quality of Work Life for Employees in ORS • L2. Maintain and Enhance Competencies for Future Organization Provide Facility Management and Maintenance Services
Learning and Growth Perspective L1. Objective: Enhance Quality of Work Life for Employees L1.1 Measure: Conclusions from L&G Data Low Turnover indicates high satisfaction with job Low sick leave indicates work force commitment to the mission Low ER-ADR-EEO indicates an open atmosphere where employees can discuss issues before they become problems Provide Facility Management and Maintenance Services
Learning and Growth Perspective L2. Objective:Maintain and Enhance Competencies L2.1 Measure: Analysis of Readiness Conclusions Projected Hiring: Need additional maintenance service personnel to reduce amount of square footage under supervision. Contractor Requirements: Increasing repair and replacement requirements will require an increase in contractor service for mechanical, electrical improvements. Training Requirements: A new emphasis on more competency training across the board – especially regarding CMMS for all employees in PWB. Provide Facility Management and Maintenance Services
Financial Perspective • Financial Objectives • F1. Minimize Unit Cost at DS Level • F2. Maximize Asset Utilization Provide Facility Management and Maintenance Services
Financial Perspective Objective: Minimize Unit Cost at DS Level Measure: Unit Cost for 9 Discrete Services Provide Facility Management and Maintenance Services
Asset Utilization Measures for all Discrete Services Provide Facility Management and Maintenance Services
Conclusions and Recommendations • Data Collection via SOP within CMMS is critical to PWB Management Decision Making • Reinforce Compliance with PWB SOP’s • Re-educate PWB Personnel on Workflow and Data Collection Protocol • Centralized Cost Accounting throughout ORS using a cost effective time and cost accounting system such as MS2000 • Combine “Replace Obsolete Systems” with “Perform Preventive Maintenance” • Establish a Public Space PM program Provide Facility Management and Maintenance Services
Appendices Provide Facility Management and Maintenance Services
Appendices • Include the following: • Page 2 of your ASA Template • Customer segments graphs • Customer satisfaction graphs • Block diagram • Process maps • Process measure graphs • Learning and Growth graphs • Analysis of Readiness Information • Unit cost graphs • Asset utilization graphs • Any unique measures graphs Provide Facility Management and Maintenance Services
C1. Objective: Increase Understanding of the Customer BaseC1.1Measure: Customer Segmentation Chart for DS1-8 Factored SF = 12.76 M Non Factored SF = 9.48 M Factors: Animal = 2.0, Lab = 1.5 Provide Facility Management and Maintenance Services
C1. Objective: Increase Understanding of the Customer BaseC1.1 Measure: Customer Segmentation Chart for DS9 Total = 91773 SF Provide Facility Management and Maintenance Services
DS1: Manage Facility Operations and ServicesMeasure:Reduce weighted average days for completion time for trouble calls by section Target FY O3 7.0 Days Provide Facility Management and Maintenance Services
DS2: Provide Sanitation ServicesMeasure:Increase % of buildings scoring 90% on inspection FY03 Target Mo Avg. = 31 FY02 Actual Mo. Avg. = 28 Provide Facility Management and Maintenance Services
DS3: Provide NIH-wide Pest Management ControlMeasure:Reduce # of recommendations not adopted after 90 days Recommendations Total Recommendations Feb 02 – May 02 Inspection Cycle FY 02 Total > 90 = 115 FY 03 Target = 100 Oct 01 –Jan 02 Inspection Cycle Age of Recommendations Provide Facility Management and Maintenance Services
DS4: Operate Dynamic Building System (FY03 Measure) Measure: Define the sq. footage operated and maintained per Maintenance Staff and compare to industry standards to develop baseline FY 03Target To be developed and compared to industry standards Provide Facility Management and Maintenance Services
DS5: Respond to Service CallsMeasure:Increase % of Trouble calls submitted over the Web Actual = 33% Target = 50% Non-Web based calls Web based calls= 33% Avg. Provide Facility Management and Maintenance Services
DS6: Perform Preventive MaintenanceMeasure:Reduce% of Electrical PM Failures Target: Reduce Failure Rate to 7 % Provide Facility Management and Maintenance Services
DS7: Replace Obsolete Building Systems and Components(FY03 Measure)Measure: Reduce Percentage of PM generated Small Purchase and Repair Work Items that are Incomplete Recommendation: DS7 be folded into DS6 – Perform Preventive Maintenance. This measure would be retained as a second measure for DS6 Provide Facility Management and Maintenance Services
DS8:Maintain Public Space (New Measure For FY 03)Measure:Equal or Exceed SLA % of square footage inspected by FM’s via an Established PM Program in CMMS Notional Provide Facility Management and Maintenance Services
DS9:Manage Residential PropertyMeasure:New FY03 – Improve Service Call Completion Cycle Total # of Service Calls Per Bldg. This chart shows the distribution of FY02 calls. The Measure will show the avg. time to close out service calls on residential property. Provide Facility Management and Maintenance Services
Facilities Management and Maintenance Services Block Diagram Provide Facility Management and Maintenance Services
Process Flow Map: DS1 – Manage Facility Operations and Services Provide Facility Management and Maintenance Services