Methane production - Methanogenesis Substrates / pathways Isotopic studies Hydrogen cycling Methane consumption - Ana
Methane production - Methanogenesis Substrates / pathways Isotopic studies Hydrogen cycling Methane consumption - Anaerobic methane oxidation Methane hydrates (Thermogenic methane) (Hydrothermal vent methane). Methanogens (Zinder; Oremland) Archaea.

Methane production - Methanogenesis Substrates / pathways Isotopic studies Hydrogen cycling Methane consumption - Ana
E N D
Presentation Transcript
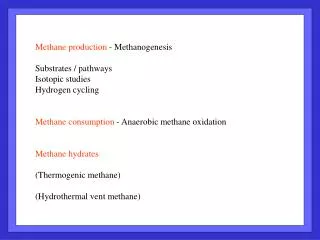
Methane production - Methanogenesis Substrates / pathways Isotopic studies Hydrogen cycling Methane consumption - Anaerobic methane oxidation Methane hydrates (Thermogenic methane) (Hydrothermal vent methane)
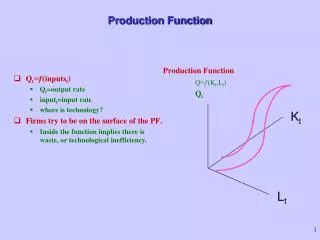
Methanogens (Zinder; Oremland) Archaea. Relatively few species (30-40), but highly diverse (3 orders, 6 families, 12 genera). Strict anaerobes. Highly specialized in terms of food sources – Can only use simple compounds (1 or 2 carbon atoms), and many species can only use 1 or 2 of these simple compounds. Therefore, dependent on other organisms for their substrates; food web / consortium required to utilize sediment organic matter.
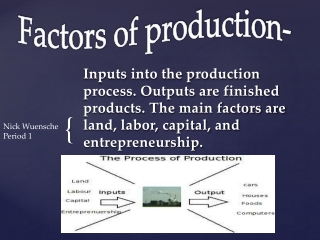
Two main methanogenic pathways: CO2 reduction Acetate fermentation Both pathways found in both marine and freshwater systems Many other substrates now recognized
CO2 reduction Acetate fermentation Zinder, 1993
Acetate fermentation CO2 reduction
Obligate syntrophy between an acetogen and a methanogen is common Each species (e.g., a methanogen and an acetogen) requires the other: the acetogen provides the hydrogen; the methanogen prevents a build-up of hydrogen (which inhibits the acetogens)
Obligate syntrophy is common Both species (e.g., a methanogen and an acetogen) require the other: the acetogen provides the hydrogen; the methanogen prevents a build-up of hydrogen (which inhibits the acetogens) In marine sediments, methanogens are competitive only after sulfate is gone (< 0.2 mM sulfate). Sulfate reducers keep H2 partial pressure too low for methanogens. (T. Hoehler et al.)
Porewater sulfate and H2 in Cape Lookout Bight sediments Estimated porewater H2 turnover times are very short (0.1 to 5 s); profile H2 gradients don’t reflect transport, but “local” production rate variations. Hoehler et al., 1998
Hoehler et al. – Microbial communities maintain porewater H2 concentrations at a minimum useful level (based on the energy they require to form ATP from ADP). The bulk H2 may reflect the geometry of the H2 producer / H2 consumer association. H2 consumer – sulfate reducer H2 producer – fermenter Higher bulk H2 Lower bulk H2
Dominant pathway for methanogenesis? Stable isotope approaches. 4H2 + HCO3- + H+ => CH4 + 3H2O All H from water Distinct dD (stable hydrogen isotope) values for CO2 reduction and acetate fermentation, based on source of the hydrogen atoms. 3 of 4 H from acetate CH3COO- + H2O => CH4 + HCO3- Whiticar et al., 1986
Whiticar et al., 1986; but maybe not so simple see Waldron et al., 1999 CO2 reduction - Slope near 1, all H from water Methanogenesis in freshwater systems dominated by acetate fermentation (larger fractionation); in (sulfate-free) marine systems, by CO2 reduction (smaller fractionation) Fermentation - Slope much lower, 1 of 4 H from water
What happens to all this methane? Diffusive transport up into oxic zone – aerobic methane oxidation Bubble ebullition (in shallow seds, with strong temperature or pressure cycles) followed by oxidation in atmosphere Anaerobic methane oxidation coupled to sulfate reduction Gas hydrate formation
Alperin and Reeburgh, 1984 Skan Bay, AK. Seasonally anoxic bottom water, sediments uniformly black, with millimolar hydrogen sulfide in p.w.. Oxygen penetration depth = 0 Anaerobic methane oxidation “controversial” (impossible) – no AMO mechanism had been demonstrated, no organism capable of AMO had ever been isolated.
Alperin and Reeburgh, 1984 14C based CH4 oxidation rate profile consistent with pore water methane profile; methane oxidation to CO2 in anoxic zone.
Stable isotope profiles also consistent with methane oxidation to CO2 in anoxic zone.
Sulfate profiles and SR rate profiles match, too. Alperin and Reeburgh, 1985
Anaerobic methane oxidation by a consortium, made up of: sulfate reducers (with H2 as electron acceptor) SO4-2 + 4H2 => S= + 4H20 And methanogens (running in reverse, due to low pH2) CH4 + 2H2O => CO2 + 4H2 Together yielding CH4 + SO4-2 => HS- + HCO3- + H2O (Hoehler et al., ‘94)
Used fluorescent probes to label, image aggregates of archaea (methanogens, red) and sulfate reducers (green) in sediments from Hydrate Ridge (OR) – observed very tight spatial coupling. Boetius et al., 2000
H2S production CH4 consumption Sediment incubations (Hydrate Ridge) demonstrating anaerobic methane oxidation, strong response to CH4 addition. Nauhaus et al., 2002
Anaerobic methane oxidation coupled with sulfate reduction CH4 + 2H2O => CO2 + 4H2 SO4-2 + 4H2 => S= + 4H20 DeLong 2000 (N&V to Boetius et al.)
Low T + high P + adequate gas (methane, trace other HC, CO2) => gas hydrate Why do we care about methane hydrates? Resource potential Fluid flow on margins Slope destabilization / slope failure Chemosynthetic biological communities Climate impact potential Another fate for methane – gas hydrate formation
Kvenvolden, ‘88 1 m3 hydrate => 184 m3 gas + 0.8 m3 water DIC = 980 Terr bio = 830 Peat = 500 Atm = 3.5 Mar bio = 3 Total fossil fuel = 5000 x 1015 gC total hydrate = 10,000 x 1015 gC (a guess!)
Methane hydrate stability Methane gas Methane hydrate
Stable T and P, not enough methane permafrost Continental margin
Known global occurance of gas hydrates Most marine gas hydrates have d13C values lower than –60 o/oo, and are of microbial origin. Hydrates with higher d13C values (> - 40 o/oo) and containing some higher MW hydrocarbons are thermogenic
Geophysical signature of gas hydrates: presence of a “bottom simulating reflector” in seismic data, due to velocity contrast (hydrate / free gas). water sediment hydrate free gas
Porewater evidence of hydrate dissociation: low Cl- in zone of hydrate dissociation (during core recovery; decompression, warming)
Warming to LPTM – Late Paleocene thermal maximum Abrupt, global low-13C event in late Paleocene (benthic foraminifera, planktic foraminifera, terrestrial fossils): A gas hydrate release?
Dickens et al., 1997 High-resolution sampling of the 13C event. Magnitude, time-scales, consistent with sudden release of 1.1 x 10¹⁸ g CH4 with d13C of –60 o/oo, and subsequent oxidation. Did warming going into LPTM drive hydrate dissociation, and methane release? Did similar (smaller) events occur during the last glaciation? (Kennett)
Simultaneous low-d13C excursions in benthic and planktonic foraminifera consistent with release (and oxidation) of light methane, as a result of destabilization of clathrates – the .
Marine clathrates Terrestrial wetlands A constraint on hydrate release from the dD of methane in ice cores. Sowers, 2006
Clathrate release should result in lower dD values (black model line); instead, dD tends to increase with CH4 increase. Sower’s conclusion - the glacial methane increases were not caused by clathrate release. Sowers, 2006