Download
1 / 13
130 likes | 234 Vues
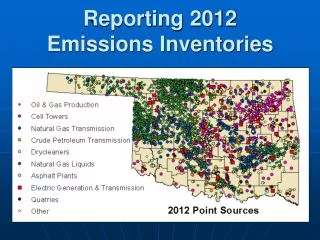
Space-based Constraints on Global SO 2 Emissions and Timely Updates for NO x Inventories. Randall Martin, Dalhousie and Harvard-Smithsonian Chulkyu Lee, Dalhousie National Institute of Meteorological Research, Korea Lok Lamsal, Aaron van Donkelaar, Akhila Padmanabhan, Dalhousie University

E N D
Space-based Constraints on Global SO2 Emissions and Timely Updates for NOx Inventories Randall Martin, Dalhousie and Harvard-Smithsonian Chulkyu Lee, Dalhousie National Institute of Meteorological Research, Korea Lok Lamsal, Aaron van Donkelaar, Akhila Padmanabhan, Dalhousie University Thomas Walker, Dalhousie University University of Toronto Russell Dickerson, Jennifer Hains, Konstantine Vinnikov, U. Maryland Nickolay Krotkov, NASA Andreas Richter, University of Bremen
Accurate Emission Inventories Needed for Climate and AQ E.g. What is the role of SO2 Emissions in Aerosol Pollution Global Climatology (2001-2006) of PM2.5 from MODIS & MISR AODand GEOS-Chem AOD/PM2.5 Relationship Evaluation for US/Canada r=0.78 slope=1.02 n=1073 Evaluation with measurements outside Canada/US Poster 4611 van Donkelaar et al., EHP, 2010
Insight into Aerosol Source/Type with Precursor Observations Operational OMI PBL SO2 data corrected with local air mass factor improves agreement of OMI SO2 versus aircraft observations (INTEX-B) Orig: slope = 1.6, r = 0.71 New: slope = 0.95, r = 0.92 OMI Improved SO2 Vertical Columns for 2006 Lee et al., JGR, 2009
Anthropogenic Sources Dominate Annual Mean SO2 Column Volcanic SO2 Emissions 10% of Anthropogenic Source GEOS-ChemSimulations for 2006 Total SO2 Column Anthropogenic SO2 Column Fraction from Anthropogenic Lee et al., JGR, in prep.
Use OMI and SCIAMACHY SO2 Columns to Map SO2 Emissions Tropospheric SO2 column ~ ESO2 Over Land day OH, cloud SO42- DMS SO2 ~day Deposition Emission Phytoplankton Combustion, Smelters, Volcanoes Top-Down Emissions
Evaluate GEOS-Chem SO2 Lifetime vs Calculations from In Situ Measurements U Maryland Research Flights for Eastern U.S. C is SO2 from EPA Network H is GEOS Mixed Layer Depth June - August Hains, Dickerson, et al., 2007 Lee et al., JGR, in prep.
Global Anthropogenic Sulfur Emissions Over Land for 2006Volcanic SO2 Columns (>1x10¹⁷molec cm-2) Excluded From Inversion Top-Down (OMI) 49.9 Tg S/yr Bottom-Up in GEOS-Chem (EDGAR2000, NEI2005, EMEP2005, Streets2006) Scaled to 2006 r = 0.77 54.6 Tg S/yr SO2 Emissions (1011 molecules cm-2 s-1) Lee et al., JGR, in prep. Cloud Radiance Fraction < 0.2
Anthropogenic Emissions Differences (2006) -2.2 Tg S/yr -4.7 Tg S/yr Cloud Radiance Fraction < 0.2, SZA < 50o Lee et al., JGR, in prep.
Application of Satellite Observations for Timely Updates to Emission Inventories Use GEOS-Chem to Calculate Local Sensitivity of Changes in Trace Gas Column to Changes in Emissions Fractional Change in Emissions Fractional Change in Trace Gas Column Local sensitivity of column changes to emissions changes Apply to regions where anthropogenic emissions dominate (>50%) Walker et al., ACPD, 2010 Lamsal et al., GRL, in prep
Evaluate Hindcast Inventory Versus Bottom-upHindcast for 2003 Based on Bottom-up for 2006 and SCIAMACHY NO2 for 2003-2006 Bottom-up Hindcast Poster 4206 Lamsal et al., GRL, in prep
Forecast Inventory for 2009 Based on Bottom-up for 2006 and SCIAMACHY NO2 for 2006-2009 9% increase in global emissions 21% increase in Asian emissions Poster 4206 Lamsal et al., GRL, in prep
Challenges Encouraging Prospects to Apply Satellite SO2 and NO2 Observations to Constrain Anthropogenic Emissions and Recent Changes • Better understanding of differences between OMI and SCIAMACHY SO2 • Reduce uncertainty in simulated SO2 lifetime • Develop adjoint-based inversions • Reconcile differences between top-down and bottom-up inventories Acknowledgements: Environment Canada, Health Canada, NASA