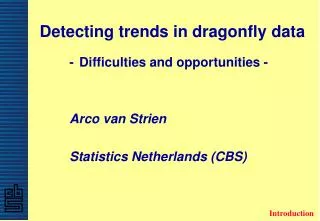
Detecting trends in dragonfly data
Detecting trends in dragonfly data. - Difficulties and opportunities - Arco van Strien Statistics Netherlands (CBS). Introduction. Statistics Netherlands’ involvement in monitoring . International: European Wild Bird Indicators European Grassland Butterfly Indicator

Detecting trends in dragonfly data
E N D
Presentation Transcript
Detecting trends in dragonfly data • -Difficulties and opportunities - • Arco van Strien • Statistics Netherlands (CBS) Introduction
Statistics Netherlands’ involvement in monitoring • International: • European Wild Bird Indicators • European Grassland Butterfly Indicator • European Bats (in development) • National: • Breeding birds • Waterbirds • Flora • Amphibians • Reptiles • Butterflies • Dragonflies • Bats and a few other mammals • Lichens • Fungi • Close co-oparation with NGO’s for each species group • NGO’s responsible for field work (mainly by volunteers) • Statistics Netherlands responsible for statististical analysis Introduction
Structure of talk • Difficulty 1: Statistical power • Difficulty 2: Bias • Three monitoring alternatives: • No standardisation of field method • Strong standardisation & analysis method TRIM • Medium standardisation & analysis method Occupancy modeling • Combining trends (European perspective) • Conclusions Introduction
Difficulties in trend detection: • Inability to detect existing trends (low statistical power) • Even more worse: Biased trend estimates (increase or decline larger or smaller than in reality) Monitoring schemes need to have: • Sufficient statistical power to detect trends • No or negligible bias in trend estimates Introduction
Statistical power is low if: • Yearly fluctuations in abundance are high • Sites have different year-to-year changes Dragonflies have considerable fluctuations in abundance … Power
Statistical power is low if: • Yearly fluctuations in abundance are high • Sites have different year-to-year changes Remedies: • Sufficient sampling effort (= no. of sites; exact no. sites required depends on a.o. field method) • Use longer detection period (= wait longer) Power
A longer detection period leads to more accurate trend estimates Years Length of time series of smooth snake Coronella austria Power
Monitoring schemes need to have: Risk of bias is higher if: • Sufficient statistical power to detect trends • No or negligible bias in trend estimates • Sampling effort per site is not constant across years • Detectability of species is not constant during the season and between years • Inadequate sampling strategy applied e.g. dragonfly-rich areas oversampled Bias
Increasing sampling effort leads to artificial increase High sampling effort Index of species Low sampling effort Bias
Risk of bias is higher if: • Sampling effort per site is not constant across years • Detectability of species is not constant during the season & years • Inadequate sampling strategy applied e.g. dragon-rich areas oversampled Remedies: • Standardize sampling effort (field method) • Take into account variation in detectability during the season (= multiple visits) • Apply adequate sampling strategy (or adjust a posteriori any bias due to unequal sampling) Bias
Structure of talk • Difficulty 1: Statistical power • Difficulty 2: Bias • Three monitoring alternatives: • No standardisation of field method • Strong standardisation & analysis method TRIM • Medium standardisation & analysis method Occupancy modeling • Combining trends (European perspective) • Conclusions Alternatives
Monitoring alternatives Alternatives
No standardisation of field method • As in Atlas studies or studies to compile Red Lists • No fixed sites • Sampling efforts vary between years • No prescription of field method • No formal sampling strategy • Collecting presence data only • >>>> • Statistical power low (only sensitive to pick up strong declines & increases in distribution) • Risk of bias considerable due to not constant sampling efforts • Statistical analysis: simple comparison of distribution data (or a statistical method) Alternatives
Strong standardisation of field method • As in dragonfly scheme in the Netherlands • Fixed sites (500 m - 1 km long) • Yearly surveys • Multiple visits per year (during the season) • Detailed prescription of field method (fixed sampling effort per site) • Sampling strategy: preferably (stratified) random choice of sites • Collecting count data • >>>> • Statistical power high • Risk of bias low • Statistical analysis: TRIM TRIM
TRIM version 3 • Poisson regression (loglinear models, GLM) for count data Pannekoek, J. & A van Strien, 2001. TRIM 3. Statistics Netherlands, Voorburg TRIM
TRIM: Trends and Indices for Monitoring data • Specially developed by Statistics Netherlands for wildlife monitoring based on count data • Statistical heart of wildlife monitoring data analysis • Internationally accepted and in use in many European countries • Easy to use • Freeware • Calculates yearly indices TRIM
INDEX: the total (= sum of al sites) for a year divided by the total of the base year TRIM
Statistical characteristics of TRIM • Produces yearly indices and overall trends per species • Produces confidence intervals • Include overdispersion & serial correlation in models • Goodness-of-fit tests for comparing models • Covariates to test trends between sets of sites • Weight factors may be included to improve representativeness if sites are not randomly selected • Imputation of missing values TRIM
Imputation of missing counts required to compute correct indices TRIM
Medium standardisation of field method • To be developed, but think of: • Preferably fixed sites • Survey per site once every 2-3 years • Multiple visits per year (during the season) • Limited prescription of sampling effort per site, e.g. 1 hour field work • Sampling strategy: preferably (stratified) random choice of sites • Collecting presence/absence data per site per visit (or abundance categories) • >>> • Power not high • Risk of bias low • Statistical analysis: Occupancy modeling to adjust for bias due to limited standardisation Occupancy
Occupancy modeling: Recent developments in statistical methods make it possible to estimate area of occupancy while taking into account the detectability of species (which may differ according to e.g. not constant sampling efforts)Based on absence/presence data from repeated visits (capture-recapture)Statistical method is in developmentFreeware (PRESENCE, MARK) MacKenzie, D.I., J.D. Nichols, J.A. Royle, K.H. Pollock, L.L. Bailey & J.E. Hines, 2006. Occupancy estimation and modeling. Elsevier, Amsterdam. Occupancy
Occupancy modeling uses capture histories per site to separate occupancy and detectability Simple example area of occupancy 100%detection probability per visit 50% area of occupancy 50%detection probability per visit 100% Occupancy
Statistical characteristics of Occupancy modeling • Produces estimate of area of occupancy per year (or period), taking into account detectability of species • Comparing area of occupancy per period >> trend • Produces confidence intervals • Allows missing values • Covariates to allow for effect of e.g. temperature during visit, incompleteness of survey etc. • Weighting procedure (if sites are not randomly selected) to be developed Occupancy
Structure of talk • Difficulty 1: Statistical power • Difficulty 2: Bias • Three monitoring alternatives: • No standardisation of field method • Strong standardisation & analysis method TRIM • Medium standardisation & analysis method Occupancy modeling • Combining trends (European perspective) • Conclusions Combining trends
Combining TRIM results per country, weighted by population sizes, is well-developed Yearly population size of species A in country 1 Yearly population size of species A in country 2 European population trend of species A Yearly population size of species A in country 3 Yearly population size of species A in country 4 A. van Strien, J. Pannekoek & D. Gibbons, 2001. Bird Study 48:200-213 Combining trends
Example of combining TRIM results of countries: Pan-Euromonitoring Common Bird Monitoring project producing Farmland Wild Bird Indicator (EU biodiversity indicator) Gregory R.D., van Strien, A., Vorisek P. et al., 2005. Phil. Trans. R. Soc. B. 360: 269-288 Gregory, R.D., Vorisek, P., van Strien, A. et al., 2007. Ibis, 49, s2, 78-97 Combining trends
Combining areas of occupancy per country, weighted by areas, appears possible (but needs to be developed) Yearly occupancy area of species A in country 1 Yearly occupancy area of species A in country 2 European trend in occupancy area of species A Yearly occupancy area of species A in country 3 Yearly occupancy area of species A in country 4 Combining trends
Scores of alternatives Conclusions
Conclusions • Statistical enemies of monitoring: low power and bias • Standardisation of sampling effort helps to increase power and to reduce bias • Monitoring based on strong standardisation: high power & little bias. But it requires considerable sampling efforts • If strong standardisation is not feasible, consider medium standardisation: lower power, but again little bias (if detection probabilities are taken into account) • For both alternatives statistical methods are available • Both alternatives enable to combine trends across countries Conclusions