Example 2.9
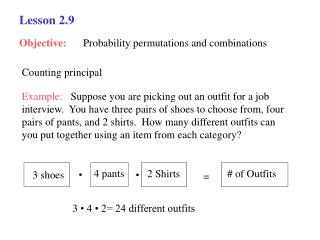
Example 2.9. Time Series Plots. TOYS.XLS. Lists quarterly sales revenues (in $ millions) for Toys “R” Us during the years 1992-1995. Display these sales data in a time series plot and comment on whether trend and/or seasonality is present. Time Series Plots.

Example 2.9
E N D
Presentation Transcript
Example 2.9 Time Series Plots
TOYS.XLS • Lists quarterly sales revenues (in $ millions) for Toys “R” Us during the years 1992-1995. • Display these sales data in a time series plot and comment on whether trend and/or seasonality is present.
Time Series Plots • When we need to forecast future values of a time series, it is helpful to create a time series plot. • This is essentially a scatterplot, with the time series variable on the vertical axis and the time itself on the horizontal axis. • Also, to make patterns in the data more apparent, the points are usually connected with lines.
Analyzing a Time Series Plot • When looking at a time series plot we usually look for two things: • Is there an observable trend? That is, do the values of the series tend to increase (an upward trend) or decrease (a downward trend) over time? • Is there a seasonal pattern? For example, do the peaks or valleys for quarterly data tend to occur every fourth observation?
Creating a Time Series Plot • To create a time series plot, we must use StatPro’s Time Series Plot menu item. This procedure allows us to plot one or more time series variables on the same chart. • In this example there is only one variable, Revenue, to plot. • We also have the option of selecting a “date” variable for labeling the horizontal axis. Here, we select Quarter (in Column A).
The Time Series Plot • This plot exhibits an obvious seasonal pattern.
Analyzing this Time Series Plot • An obvious pattern can be seen because fourth quarter sales each year are much larger than the sales from the first three quarters. Of course, this is due to the holiday season. • Also focusing on the first three quarters of each successive year, we see a small upward trend in sales.
Forecasting Future Values • If we want to forecast future quarterly sales for Toys “R” Us, we need to estimate the upward trend and seasonality of quarterly sales.