Download
1 / 30
300 likes | 407 Vues
Learn about the National Wetlands Inventory (NWI) mapping in Vermont conducted by Ralph Tiner, the regional coordinator. Discover the purpose, limitations, map scales, types of wetlands, and the process for mapping these natural resources.

E N D
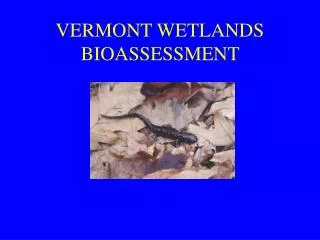
National Wetlands Inventory Mapping In Vermont Ralph Tiner, Regional Wetland Coordinator U.S. Fish and Wildlife Service Northeast Region Hadley, MA
Background • National Program • 90% of coterminous US mapped • 50% digitized • Regional Status • 12 of 13 states mapped • Updating in progress on a FWS priority basis and where outside funding is received
Purpose of Mapping • To inventory wetlands across the nation for natural resource conservation purposes • To identify and classify larger wetlands based on photointerpretation (recognizing limitations inherent in this approach) • To report on the status and trends of US wetlands and for states as mapping is completed • The NWI is not designed to map all the wetlands in any locality – that would require on-the-ground surveys applying wetland delineation techniques
Limitations of Photointerpretation for Mapping Wetlands • Photo Scale • Seasonality (environmental conditions at time of photo capture) • Photo Quality • Wetlands that are difficult to photointerpret
Photo Scale vs. Area ScaleArea In One Square Inch 1:80K 1020 acres 1:58K 540 acres 1:40K ~250 acres 1:24K 92 acres 1:12K ~25 acres
Photo Scale vs. Mapping Unit Photo Scale vs. Target Mapping Unit • 1:80,000 = 3-5 acres • 1:58,000 = 1-3 acres • 1:40,000 = 1 acre • 1:24,000 = 0.25-0.50 acre • 1:12,000 = 0.10 acre
Photo Scale vs. # of Photos Scale # of Photos/Quad #Photos/VT* 1:80,000 1 160 1:58,000 1.5 240 1:40,000 4 640 1:24,000 20 3200 1:12,000 42 6720 *Estimates based on 58 sq. mi/quad and Vermont land surface area. May be approx. 220 quads (1:24K) covering the state
Pen Width vs. Ground Distance Earlier maps were hand-drawn, so pen-width was a factor. Scale000 (0.25mm) 0000 (0.18mm) 1:80K ~67ft ~50ft 1:58K 48ft 34ft 1:40K 33ft 23ft 1:24K 20ft 14ft 1:12K 10ft 7ft
Scale Limits on Wetlands • Not simply acreage dependent • Relates to shape • one-acre block vs. one-acre linear • Relates to easy or difficulty of photointerpretation of type
Wetland Type • Easy to identify types • Marshes, bogs, seasonally flooded swamps, ponds • Harder to identify types • Drier-end wetlands • Evergreen forested wetlands • Temporarily flooded wetlands • Wetlands on slopes (seepage)
Seasonality • Environmental Conditions • Leaf on vs. Leaf off • Spring vs. Fall (leaf off) • Ambient weather • Water tables and flooding • Extreme flooding vs. droughts • Snow and ice
Photo Quality • Emulsion • Black and White (panchromatic) • True Color • Color Infrared • Resolution • Processing (over vs. under exposed) • Date (best available at 1:40K or smaller; now use DOQ/DOQQ)
Original NWI Maps for Vermont • 1:80,000 CIR • October 1977 • Target Mapping Unit = 3-5 acres • Inventory done in late 1970s/1980. • Mapping Procedures • Photointerpretation • Limited Field Work • Consultation with Soil Surveys? (No hydric soils lists/indicators) • Regional QC (spot checking) • National QC (spot checking)
NWI 220,000 acres 3.7% of the state Soil Data 341,000 acres 5.5% NWI Results vs. Hydric Soils
Updated NWI Mapping • 1:40,000 CIR • 1992-1994 • Target Mapping Unit = 1 acre • Mapping Procedures • Edit original NWI data • Photointerpretation • Limited field checking • Consult with soil surveys (interpretation) • Regional QC (entire photo) • National QC (automated verification)
New Mapping Procedures (2006) • Edit existing NWI data • Photointerpretation on-screen • DOQ or DOQQ base • Limited field checking • FWS QC, automated verification • Add undeveloped hydric soil map units • FWS QC, automated verification
Enhanced NWI • Current NWI database • Add other descriptors: • Landscape Position • Landform • Water Flow Path • Waterbody Type • Use data to predict wetland functions
LLWW Descriptors • Landscape Position • Lotic, Lentic, Terrene • Landform • Floodplain, Basin, Flat, Fringe, Slope • Water Flow Path • Inflow, Outflow, Throughflow, Bidirectional Flow, Isolated • Waterbody Type • Pond and lake types, impounded rivers, etc.
Functional Assessment 9 Functions for Inland Wetlands • Surface Water Detention • Streamflow Maintenance • Nutrient Transformation • Sediment Retention • Shoreline Stabilization • Fish and Shellfish Habitat • Waterfowl/Waterbird Habitat • Other Wildlife Habitat • Conservation of Biodiversity
Updated NWI - Highlights • Smaller wetlands • Refined boundaries • Incorporates more hydric soil map units • Can be enhanced to be more descriptive • After enhancement, can use for preliminary functional assessments • Still will not map all wetlands – need ground surveys applying delineation procedures to do this; potential vernal pool mapping through remote sensing