Download
1 / 81
820 likes | 1.01k Vues
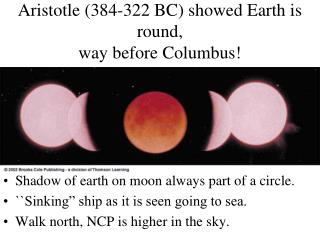
Aristotle (384-322 BC) showed Earth is round, way before Columbus!. Shadow of earth on moon always part of a circle. ``Sinking” ship as it is seen going to sea. Walk north, NCP is higher in the sky. Eratosthenes’ 200 BC calculation of size of earth. Aristotle’s geocentric theory.

E N D
Aristotle (384-322 BC) showed Earth is round,way before Columbus! • Shadow of earth on moon always part of a circle. • ``Sinking” ship as it is seen going to sea. • Walk north, NCP is higher in the sky.
Going beyond the Earth to get distance of the Moon • Must use parallax (similar to binocular vision).
Two eyes on opposite parts of Earth MOON p • Ptolemy(200 AD) discusses previous work. • 4000 miles radius of Earth • Earth radius/(2π orbit radius) = Angle p / 360o. • 60 Earth radii distance from p≈ 1o. • 240,000 miles or about 1.3 light second travel time. • Stilted conversation between astronauts and President Nixon. EARTH
Aristarchus (310--230BC) proposed that Earth went around Sun, way before Copernicus. • Shadow of round Earth on Moon. • Deduced Moon is about 1/3 size of Earth (Modern 1/4)
Aristarchus studied times 3rd Q, new, 1stQ of the Moon versus 1st, full, 3rd. • Found Sun was at least 21x Moon’s distance
As revealed by solar eclipse, the sun and moon are about the same ANGULAR SIZE. • But the sun is a lot bigger by a factor equal to ratio of distances.
Aristarchus’ results: • Sun is 21xMoon’s distance or 21xsize of Moon • Moon is 1/3 the size of the earth. • Sun is 21x(1/3)~7 x size of the earth. Modern value ~100>>Earth! • Concluded such a big sun couldn’t circle earth.
Aristarchus’ idea was rejected. Parallax from one side of Earth’s orbit to other was expected. Stars too far and parallaxes to small for ancient Greeks to accept or measure. Largest p < 1/3600 degree.
Ptolemy’s 125 AD book Almagast • Elaborated geocentric theory to quantitatively account for and predict observed motions of planets, “wanderers” in the sky. • Seven wanderers: Sun, Moon, Mercury, Venus, Mars, Jupiter, Saturn. 7 objects.
Renaissance:Nicolaus Copernicus (1473–1543) • Revived sun-centered idea ignoring failure to observe parallax. • Simpler model than earth-centered • Simpler calculations and could calculate relative sizes of planet orbits.
New! Copernicus could calculate relative sizes of planet orbits. • Know “maximum” elongation angle at Earth • SunPlanetEarth angle is 90o • Triangle gives dist. PlanetSun in AU • Also did for Mars, Jupiter, Saturn
Copernicus calculated the sizes of the planets’ orbits RELATIVE to the Earth’s orbit size (1 AU). • Death bed publication, why?
Believing the Earth circled the Sun was dangerous. Giordano Bruno burned at stake in 1600 • ``There is a single general space, a single vast immensity which we may freely call void: in it are innumerable globes like this on which we live and grow.” • ``I await your sentence with less fear than you pass it. The time will come when all will see as I see.”
The Distance of the Nearest Star • Recall Copernicus found relative distances of planets in solar system. • Copernicus calculated the sizes of the planets’ orbits RELATIVE to the Earth’s orbit size (1 AU). • But exactly how big is the Earth’s orbit and the solar system in miles or km? • To 1700’s AU very poorly known.
Basilica of San Petronio, a solar observatory 1576 by Egnatio Danti, a mathematician and Dominican friar • Aristarchus: 1 AU = 1520 Earth radii • 1650 Giovanni Cassini (France) found that Sun was much farther and Solar System much bigger than previously thought >17,000 Earth radii. • Expanded Solar System (universe) over 10x
Cassini’s San Petronio method • Noon Sun (black solid line) is farther south or lower from overhead (red) at both summer and winter solstices than it would be if infinitely far away (dashed lines) • Differences permit calculation of Sun’s distance in Earth radii. SUN EARTH SUMMER SOLSTICE EARTH WINTER SOLSTICE
Halley is famous for calculating the 75 yr elliptical orbit of “Halley’s comet” and predicting its 1758 return. Haley had an idea to more precisely measure the AU in Earth radii.
Halley’s parallax transit method. Venus crosses the Sun along different lines depending on the latitude of the observer on the Earth. • The lines differ by no more than 44 seconds of arc on disk. • Exaggerated in the drawing. The Sun is half a degree, 40 times the max difference).
1761,1769 transits observed from all over Earth, even Tahiti! • First accurate results, 1% • 93 million mi, 150x106 km. • Space probes, radar 23,500 Earth radii within meters. • 8 minutes blissful ignorance if Sun vanishes!
The long quest for stellar parallax • German astronomer Karl Bessel. • Visual observation, special telescope. • First accurate measuremnt of parallax of star 61 Cygni in 1838. • Tiny, about 0.3 seconds of arc. One arc sec= 1/3600 o
Tiny parallaxes simplify calculating distance. • Nearest star (besides the Sun) has a parallax of 0.75 sec of arc, less than 1/3600 of a degree= 1 arc sec. • Distance in parsec = 1/parallax in arc sec. • Distance = 1/0.75 = 1.33 parsecs • 1 parsec = 3.26 light years or 206,265 AU • One light year = 6 trillion miles.
Nearest star amazingly far away. • The double star in the figure, Alpha,Proxima Centaurus. • 1.3 pc away, four light years travel time. • Our info about it is over 4 years out of date!
Next “Expansion” Galileo’sStarry Messengerhttp://www.rarebookroom.org/Control/galsid/index.html
All sky photo • Meteor shower. • MW circles whole sky. • Galileo found the MW was a multitude of dim stars. • Bright stars uniform over the sky. Milky Way
Thomas Wright in 1750 clarified Galileo’s discovery. • Bright stars scattered uniformly over sky. • Milky Way divides the sky into two equal halves. • We are in mid-plane of a somewhat thick disk of stars. • Nearby stars above, below, and to sides make up bright stars on sky. • Stars so distant they appear as haze, mark out the disk plane.
Bright only. • No dim stars • in this direction. • * * * * * * * * * * * * * * • Bright * * * * * * * * * * * * • & * * * * * * * * * * * * * • dim* * * * * * * * * * * * * • * * * * * * * * * * * * * * • Bright only. • No dim stars • in this direction.
1785 Herschel surveyed and found our place in MW Galaxy • Looked in different directions w. telescope • Counted # of stars of diff apparent magnitudes • Assumed all were like the sun • Plotted number versus distance in different directions. • Disk a few thousand light years in size. Wrong!! • Sun in center. Wrong!!
This is a mosaic of visual photos of the entire sky. • Dust lanes that block view of galaxy center misled Herschel. • Also more H gas than dust.
True Size & Place • Early 20th century, Harlow Shapley • Undergrad journalism at U. of Missouri, Columbia • Wanted to take an archeology course one semester. It wasn’t offered (but astronomy was). • Became director of Harvard College Observatory.
In 1920’s, Shapley’s method • Estimated distances of globular star clusters above and below the absorbing dust of the Milky Way disk. (eg 47 Tuc >106 stars, 50 pc). • Used RR Lyrae variable stars as ``distance indicator”. • Periods of <1day and 100x Sun’s luminosity. • Got distances from RR Lyrae intensity and luminosity.
Most globular clusters are seen on one side of the sky • Shapley plotted their directions and distances • A spherical swarm whose center is in the direction of the nearby stars of the constellation Sagittarius. • Center ~30,000 light years away.
Modern MW Map • Disk has mostly stars, galactic clusters of stars (like Pleiades) + some H, He gas, and dust. • Halo has swarm of globular clusters, scattered old stars, and other unknown objects. • Nuclear bulge is mostly stars + some gas, dust.
Galaxies: A big step beyond. • Initially were ``nebulae,” fuzzy patches of light beyond the solar system. • Messier cataloged ~100 in 1700’s for comet hunters. • M31 is #31 in the list. • Herschel in early 1800’s cataloged 1000’s in New General Catalog e.g. NGC205
Study of nebulas via spectroscope. • Some showed emission line spectra • These were clouds of thin gas in our galaxy. • Mostly hydrogen • Supernova ejection or gas which may form stars later. • Others had continuous spectra with absorption lines. • Like a star’s spectrum. Figure below • Astronomers were uncertain about these. • Collection of stars or one star and reflecting dust? M87 Absorption line spec.
Cepheid Variables • Shapley’s RR Lyrae stars (100xSun) not luminous enough to use outside MW Galaxy • Herietta Leavitt(Harvard)~1915 • Cataloged 1000’s of variable stars! • Found a new variable 10,000 x Sun, Cepheids • Useful outside MW gal.
An Example of a Cepheid Variable in MW Galaxy. • Are pulsating giant stars • Very distinctive because of their brightness variation > 1 day up to 50 days.
10,000 Sun • Leavitt found Cepheid variable stars, in a satellite galaxy of MW. • All at same distance. • Found “period-luminosity” relation, • Observe P, know luminosity, compare to intensity. • Can thus estimate distance of the galaxy 100 Sun
Getting M31’s Distance • 1920’s Edwin Hubble observed what was called the ``Great Nebula in Andromeda” Top photo. • IDed Cepheid variables. • Hubble’s negative photo=> • Var! marks his exciting discovery of a Cepheid. • Compared M, m to get distance
M31’s huge distance from Cepheids • The graph shows magnitudes of 20 day Classical Cepheids if they were at 10 pc (~33 lyr), -5. • Hubble found M31’s 20 day Classical Cepheid apparent magnitudes are +20. • 1010 times less intense. • 3x10⁶ lyr Math details 33 ly x √(1010 ) reversing the inverse square law.
Expanding the Andromeda “Nebula” • The farther away, the bigger the physical size • Modern result Andromeda Nebula, M31, is 780,000 pc, 780 kpc, • 2.4 million LY away, far outside MW Galaxy • Radio observations => disk ~3o in angular diameter. • 3o/360o= Size/(2πx2.4 million LY) • Size about 126,000 LY in diameter. • Andromeda Galaxy, bigger than Milky Way Galaxy. • But this info is two million yr old Earth
Systems of galaxies: The Local Group • ~Several million light years across=One million pc
Beyond Local Group • Virgo Cluster • ~50,000,000 LY • 17,000 kpc away • Over 1000 galaxies • 7 million LY size • 12x size moon. • Giant E, M87, center M87
. • 1920’s Edwin Hubble and Milton Humason worked together at Mt Wilson observatory. Hubble getting distances of galaxies and Humason getting spectra. • Expected to find some coming toward us, some away. • That’s what they and others found for nearby galaxies. • But when they got distances and spectra of more distant galaxies, Hubble noticed a pattern. Humason
Redshift-Distance Correlation • Hubble used distance indicators (variable stars, novae, supernovae etc) to estimate distance. • Humason got spectra. Identified characteristic element lines (eg Calcium) • Measured wavelength compared to sample on earth. • They found larger redshifts the larger a galaxy’s distance.
Measuring Redshifts • Distances are in Millions of pc= 3.26 million LY on x axis. • Pair of dark Calcium absorption lines in spectra. • V=0 wavelengths indicated by blue lines. • Red arrows=red shifts. • Calculated velocities in km/s are plotted on y axis.
First graph data Hubble made pointing out the pattern. • More distant galaxies have larger redshifts (velocities away). • Distance is most uncertain quantity.