Download
1 / 21
210 likes | 378 Vues
Emission Inventory Construction in Asia. David G. Streets Argonne National Laboratory, USA ACCENT/GEIA Workshop on Anthropogenic emissions for non-OECD countries in global inventories IIASA, Austria February 8-10, 2006. Energy Use.

E N D
Emission Inventory Construction in Asia David G. StreetsArgonne National Laboratory, USAACCENT/GEIA Workshop onAnthropogenic emissions for non-OECD countries in global inventoriesIIASA, AustriaFebruary 8-10, 2006
Energy Use General methodology used for developingAsian emission estimates at regional scale Other human activities Biomass burning Technology Model Activity data Biogenic, Volcanic, Dust Emission factors, Regulations Natural emissions Emission Controls Anthropogenic emissions “Total” emissions …for regulatory analysis …for scientific analysis
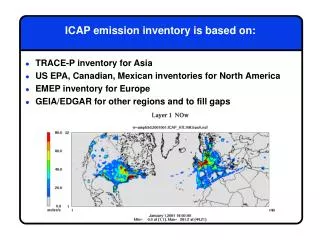
The TRACE-P inventory (Streets et al., JGR, 108, 8809, 2003):SO2, NOx, CO2, CO, CH4, NMVOC (19 classes), BC, OC, NH3 SO2 Yr 2000 30x30 min http://www.cgrer.uiowa.edu/EMISSION_DATA/index_16.htm
Experiments such as TRACE-P and ACE-Asia employ mobile “super-sites” and provide opportunities to study emissions Surprisingly high values of some species, particularly CO and BC, observed close to the coast of China China Spring 2001
SpeciesObservedModeled CO, ppbv 219 203 Ethane, ppbv 2.0 1.6 Propane, ppbv 0.62 0.46 Ethene, ppbv 0.18 0.20 Ethyne, ppbv 0.78 0.63 SO2, ppbv 1.55 1.04 NO2, ppbv 0.27 0.25 NO, ppbv 0.035 0.041 Benzene + toluene, ppbv 0.33 0.19 BC, mg m-3 0.84 0.67 Comparison of observed and STEM-simulated mean concentrations for TRACE-P DC-8 flights ataltitudes below 1 km showedquite good agreement
Though the TRACE-P inventory seems good for mostspecies, CO is under-estimated in the Yellow Sea Model under-prediction
Emission Inventory Methods: 80-110 Tg for China; 100-130 Tg for East Asia (EDGAR, TRACE-P, Tonooka et al., IPCC) Chemical Transport Modeling and Inverse Modeling: 150-180 Tg for China; 190-220 Tg for East Asia (Palmer et al., Tan et al., Arellano et al., Heald et al.) Further analysis of TRACE-P CO showed a significant disagreement between inventories and atmospheric modeling
Detailed characterization of technology is necessaryto improve CO, PM, and HC emission estimates(Zhang Qiang and He Kebin, Tsinghua University) Good Efficiency Moderate Efficiency Poor Efficiency
Improved CO emission inventory for China 36% increase Most of the increase in CO emissions is in the industrial sector, and is due to higher emission factors for small kilns and boilers.
Performance of STEM model with new CO emissions: better correlation, but under-prediction at high concentrations remains (spatial resolution issue?)
Ship lanes Surrogate data sets are used for spatial allocation Regional Emissions LPS & Volcanoes Population Land cover Road networks Precipitation Fire counts TOMS AI
Rapid development of industrial and commercial areas can change the spatial patterns of emissions in just a few years(e.g., Shenzhen, Dongguan) Guangzhou 2003 1993 Courtesy of Jimmy Fung, HKUST TRACE-P SO2 emissions at 30 sec. resolution (~700 m) for the Pearl River Delta (~150 km x 150 km) are based on mid-1990s spatial allocation factors Hong Kong Macau/Zhuhai
Time development of emissions can also be an issue:Coal consumption in China, 1995-2003 Annual Rate (total): 3.7% (1995-2003) Energy data are from China Energy Statistical Yearbook
Satellite imagery (GOME and SCIAMACHY) is providing important new information on emissions (Richter et al., Nature, Sept 1, 2005)
NOx concentrations do not show a big increase through 2002 (Hao and Wang, JAWMA, 55, 1298-1305, 2005) Change of standard
SO2 emission trends in China and GOME tropospheric SO2 measurements (Richter et al.)
Annual average SO2 concentrations in Chinese cities (Hao and Wang, JAWMA, 55, 1298-1305, 2005) Emissions shift: cities to suburbs to towns to countryside?
Particulate matter is a continuing problem in Chinese cities (including regional fine PM), and PM inventories are poor
Climate concerns have prompted work onthe PM components BC and OC for China(adapted from Zhang Xiao-Ye, CMA) FF only FF only BC FF only OC
Mercury emissions in China(Streets et al., Atmos. Env., 39, 7789, 2005) Annual Rate (total): 2.9% (1995-2003) Total Emissions: 552.2 tons (1995) 695.5 tons (2003)
We are starting a new, joint USEPA/SEPA project to improve regional emission inventories for China 1 Compare TRACE-P and other China inventories. 2 Focus on key regions: Beijing/Tianjin/Bohai, Shanghai/Yangzi Delta, Guangzhou/Hong Kong/PRD (possibly also Sichuan Basin). 3 Identify key gaps and uncertainties. 4 Improve EI data and methods and update to 2003/2004. 5 Test inventories in regional AQ models. 6 Transfer EI capability to regions.