Pretest
Pretest. Chapter 1. 1. True or False: Science and technology are NOT related. 2. Which of the following are areas of science? a. biology and chemistry b. astronomy and geology c. zoology and botany d. all of the above 3. Why do scientists document their observations and experiments? .

Pretest
E N D
Presentation Transcript
Pretest Chapter 1 1. True or False: Science and technology are NOTrelated. 2. Which of the following are areas of science? a. biology and chemistryb. astronomy and geologyc. zoology and botanyd. all of the above 3. Why do scientists document their observations and experiments?
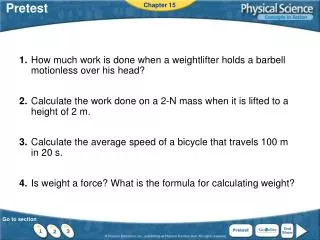
Pretest (continued) Chapter 1 4. Which number is the largest? a. 1.13 x 10⁹b. 3.51 x 10³c. 5.88 x 10⁵d. 7.92 x 10² 5. Which unit can be used to measure volume? a. mb. m2c. m3 6. Which of the following units is the longest? a. meterb. centimeterc. kilometerd. millimeter
Pretest (continued) Chapter 1 7. What is the slope of a line? 8. What types of graphs have you seen before?
Interest Grabber Section 1.1 Science Improves Our Quality of Life Advances in science have led to devices that make our lives easier and more pleasant. For example, the microwave oven makes it possible to prepare meals and snacks in minutes rather than hours. 1. Name five household devices that make your life easier or more pleasant. 2. Go through your list and describe how each device’s function was accomplished before its invention.
Reading Strategy Previewing a. Earth and Space b. Life c. The study of nonliving d. The study of Earth and things the universe beyond Earth
Branches of Science Figure 3
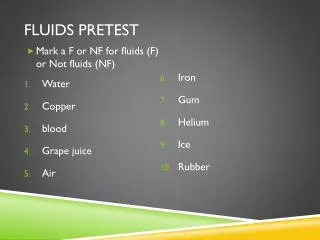
Interest Grabber Section 1.2 Design Your Own Experiment Suppose that you want to conduct a test to see which brand of cleanser produces the best results when cleaning a kitchen floor. Think about how you would conduct this test. 1. What materials would you need? 2. What procedure would you follow? 3. How would you determine which cleanser produces the best results?
Reading Strategy Section 1.2 Previewing a. Forming a hypothesis b. Testing a hypothesis c. Drawing conclusions d. Developing a theory
A Scientific Method Figure 7
A Scientific Method Figure 7
A Scientific Method Figure 7
A Scientific Method Figure 7
A Scientific Method Figure 7
A Scientific Method Figure 7
Interest Grabber Section 1.3 Measuring Length by the Handful The English units that we use in the United States developed over a long period of time. For example, the hand was devised in ancient times as a unit of length. It was defined as the length of a person’s hand from the little finger to the thumb. Today the height of horses is still measured in hands, but the definition of a hand is standardized at 4 inches or 10.16 centimeters. 1. Why did the hand produce unreliable measurements before it was standardized? 2. Measure the height of your desk in hands. Compare your results with other classmates. How do the results vary?
Reading Strategy Section 1.3 Previewing Possible answers may include: a. What is SI? SI is a set of metric measuring units used by scientists. b. What are base units? Base units are the fundamental units of SI. There are seven SI base units, including the meter, the kilogram, the Kelvin, and the second.
SI Base Units Figure 13
Using Scientific Notation Section 1.3
Using Scientific Notation Section 1.3
Using Scientific Notation Section 1.3
Using Scientific Notation Section 1.3
Interest Grabber Section 1.4 Creating and Interpreting Graphs Many people have pets. One survey of pet owners showed the following breakdown of the type of pets owned: 35% dogs; 35% cats; 10% birds; 5% hamsters, gerbils, mice, rats; 5% reptiles; and 10% other. 1. Copy the incomplete circle graph below on your paper. Complete the graph using the survey data. Estimate the angle of each section of your completed circle graph. Give your graph a title and label what each section of the graph represents. 2. Explain how viewing the graph conveys information to the reader more quickly than reading the list of data.
Reading Strategy Section 1.4 Previewing a. Variable y is plotted vs. variable x. b. Showing how a variable responds to changes in another c. Scaled bars used to represent d. Comparing a similar set various measurements of data e. A divided circle, with each “slice” f. Showing how a part relates to representing a proportional fraction the whole
Mass vs. Volume of Water Figure 21
Pretest Answers Chapter 1 1. True or False: Science and technology are NOT related. 2. Which of the following are areas of science? a. biology and chemistryb. astronomy and geologyc. zoology and botanyd. all of the above 3. Why do scientists document their observations and experiments? Sample answer: to remember them correctly or analyze them at a later time Click the mouse button to display the answers.
Pretest Answers (continued) Chapter 1 4. Which number is largest? a. 1.13 x 10⁹b. 3.51 x 10³c. 5.88 x 10⁵d. 7.92 x 10² 5. Which unit can be used to measure volume? a. mb. m2c. m3 6. Which of the following units is the longest? a. meterb. centimeterc. kilometerd. millimeter Click the mouse button to display the answers.
Pretest Answers (continued) Chapter 1 7. What is the slope of a line? 8. What types of graphs have you seen before? the ratio of a vertical change to the corresponding horizontal change Sample answers: line, bar, and circle graphs Click the mouse button to display the answers.
Interest GrabberAnswers Section 1.1 1. Name five household devices that make your life easier or more pleasant. Answers will vary. Sample answers include an electric hair dryer, electric curling iron, electric razor, electric steam iron, compact disc player, home computer, or television. 2. Go through your list and describe how each device’s function was accomplished before its invention. Answers will vary. Before the invention of the hair dryer, hair was air dried. Before the invention of the electric curling iron, wet hair was rolled onto a brush or plastic rollers. Before the electric steam iron, metal irons were heated on the surface of wood-burning stoves.
Interest GrabberAnswers Section 1.2 1. What materials would you need? Sample answers may include two or more brands of cleansers, sponge or rag, stopwatch, and different materials to produce stains. 2. What procedure would you follow? Sample procedures might test the effect of various cleansers on one type of stain, or on several types of stains. Students might try to control certain variables in the experiments, such as the amount of cleanser used or the time spent scrubbing. 3. How would you determine which cleanser produces the best results? The quality of each cleanser could be described in terms of how fast it cleans, how many types of stains it cleans, or how much is needed to clean a stain.
Interest GrabberAnswers Section 1.3 1. Why did the hand produce unreliable measurements before it was standardized? The width of a hand varies from person to person; therefore, measurements using hands will vary. 2. Measure the height of your desk in hands. Compare your results with other classmates. How do the results vary? Because of the variety of hand sizes among the people measuring, you will find that it’s possible for the same distance to be described by a wide range of measurements in hands.
Interest GrabberAnswers Section 1.4 1. Copy the incomplete circle graph below on your paper. Complete the graph using the survey data. Estimate the angle of each section of your completed circle graph. Give your graph a title and label what each section of the graph represents. The students should complete the circle graph using the given data. Each section should be labeled. Students should not be assessed on the accuracy of their angles. 2. Explain how viewing the graph conveys information to the reader more quickly than reading the list of data. Using the graph, the reader can quickly see relationships and comparisons of the data. For example, the reader can see from the graph that dogs and cats represent the largest groups of pets. This information is more readily apparent in graphical form than in list form.
Go Online Chapter 1 Data sharing Self-grading assessment Links on universal measurements Articles on the nature of science For links on motion, go to www.SciLinks.org and enter the Web Code as follows: ccn-0011. For links on graphing, go to www.SciLinks.org and enter the Web Code as follows: ccn-0014.