SEI Capability Maturity Model: Enhancing Software Development Efficiency
Explore the impact of SEI Capability Maturity Model on software development organizations, key process areas, and cost-saving strategies. Learn about the five maturity levels and the requirements for achieving each level. Discover the benefits and challenges associated with SEI CMM implementation.

SEI Capability Maturity Model: Enhancing Software Development Efficiency
E N D
Presentation Transcript
Capability Maturity Model Software Engineering Institute www.sei.cmu.edu
CMM • 5 level assessment of a software development organization’s capabilities • Promoted by DoD • Level 3 required
CMM has multiplied • There are now many different maturity models from SEI
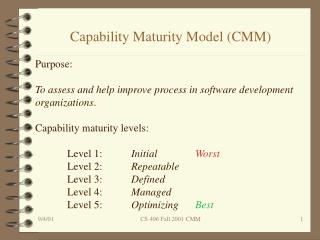
CMM levels • 5 – optimizing • 4 – managed • 3 – defined • 2 – repeatable • 1 – initial (everyone else)
KPA • Key Process Areas • Requirements for achieving a maturity level • Table 1 p 67
SEI Capability Maturity Model’sImpact on Contractors Hossein Saiedian and Richard Kuzara Computer 1995 Pp65-75
CMM • “CMM is based on the premise that major software-development problems and, hence, causes for project failures are managerial rather than technical.” p 68
Other models • Caper Jones’s model • ISO 9001
Cost of CMM • Hughes SE Division • Level 2 to level 3 • 2 years • Cost of $400, 000 • Savings of $2 million
Achieving Higher SEI Levels Michael Daskalantonakis Computer 94 Pp85-92
Motorola’s CPI • SEI Progress Assessment • Scoring each KPA activities