Download
1 / 16
160 likes | 271 Vues
This guide explores the concept of genetic pools, demonstrating the sum of all genes present in a population at a given time. It defines key terms like allele and genotype frequencies and illustrates how to calculate these frequencies using equations based on actual population data. The Hardy-Weinberg principle is introduced as a model for genetic equilibrium, highlighting conditions required for stability in allele frequencies over generations and implications for microevolution. Examples provide a practical understanding of these concepts within biological populations.

E N D
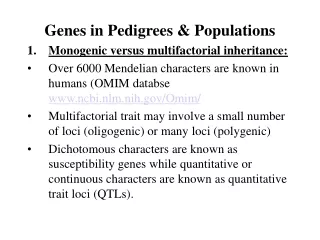
Genes in populations • Aims: • Must be able to define the term genetic pool, with examples. • Should be able to describe how genetic frequencies within a population can be done. • Could be able to describe and use equations for calculating genetic frequencies within a given population.
aa aa aa aa AA AA AA AA AA AA Aa Aa Aa Aa Aa Aa Gene Pool • A gene pool = the sum total of all the genes present in a population at any one time. • Not all the individuals will be breeding at a given time. • The population may have a distinct geographical boundary. • Each individual is a carrier of part of the total genetic complement of the population. A gene pool made up of 16 individuals
aa aa aa aa aa AA AA AA AA AA AA Aa Aa Aa Aa Aa Aa Individual is homozygous recessive (aa) Individual is homozygous dominant (AA) Individual is heterozygous (Aa) Gene Pool Geographic boundary of the gene pool A gene pool made up of 16 individual organisms with gene A, and where gene A has two alleles
aa aa AA AA Aa Aa Aa Aa Aa Analyzing a Gene Pool • By determining the frequency of allele types (e.g. A and a) and genotypes (e.g. AA, Aa, and aa) it is possible to determine the state of the gene pool. • Indicates if it is stable or undergoing change. Genetic change is an important indicator of evolutionary events. • There are twice the number of alleles for each gene as there are individuals, since each individual has two alleles.
aa AA AA Aa Aa Aa Aa Aa Aa Analyzing a Gene Pool • EXAMPLE • The small gene pool comprises 8 individuals. • Each individual has 2 alleles for a single gene A, so there are a total of 16 alleles in the population. • There are individuals with the following genotypes: • homozygous dominant (AA) • heterozygous (Aa) • homozygous recessive (aa)
aa AA AA Aa Aa Aa Aa Aa Aa DeterminingGenotype Frequencies • To determine the frequencies of different genotypes in the population, count up the actual number of each genotype in the population: • homozygous dominant (AA) • heterozygous (Aa) • homozygous recessive (aa).
No. of dominant alleles aa AA AA Aa Aa Aa Aa Aa Aa X 100 Total no. of alleles DeterminingAllele Frequencies • Count up the numbers of dominant and recessive alleles, regardless of the combinations in which they occur. • Convert these to percentages by a simple equation:
No. of dominant alleles aa AA AA Aa Aa Aa Aa Aa Aa X 100 Total no. of alleles DeterminingAllele Frequencies Allele “A” = 9/16 = 0.56 Allele “a” = 7/16 = 0.44 Allele frequencies need to total 1, so: Freq (A) + Freq (a) = 1 • This means that if only one allele is given we can easily determine the frequency of the second allele.
aa AA AA Aa Aa Aa Aa Aa Aa DeterminingAllele Frequencies • Let the: • frequency of the allele for the dominant trait be p, • and the frequency of allele for the recessive trait be q: • p + q = 1 • p = 0.56 • q = 0.44
Hardy-Weinberg Equilibrium • Populations that show no phenotypic change over many generations are said to be stable. This stability over time was described mathematically by two scientists: • G. Hardy: an English mathematician • W. Weinberg: a German physician • The Hardy-Weinberg law describes the genetic equilibrium of large sexually reproducing populations. • The frequencies of alleles in a population will remain constant from one generation to the next unless acted on by outside forces.
Conditions Required forHardy-Weinberg Equilibrium • The genetic equilibrium described by the Hardy-Weinberg law is only maintained in the absence of destabilizing events; all the stabilizing conditions described below must be met: • Natural populations seldommeet all these requirements.... • .....therefore allele frequencies will change • A change in the allelefrequencies in a populationis termed microevolution.
The Hardy-Weinberg Equation Frequency of allele combination AA in the population Punnett square • The Hardy-Weinberg equation provides a simple mathematical model of genetic equilibrium. • It is applied to populations with a simple genetic situation: recessive and dominant alleles controlling a single trait. • The frequency of all of the dominant alleles (A) and recessive alleles (a) equals the total genetic complement, and adds up to 1 (or 100%) of the alleles present. • p represents the frequency of allele A while q represents the frequency of allele a in the population. p q p q Frequency of allele combination Aa in the population (add these together to get 2pq) Frequency of allele combination aa in the population
The Hardy-Weinberg Equation • The Hardy-Weinberg equilibrium can be expressed mathematically by giving the frequency of all the allele types in the population: • The sum of all the allele types: A and a = 1 (or 100%) • The sum of all the allele combinations: AA, Aa, and aa = 1 (or 100%) Frequency of allele combination: AA (homozygous dominant) Frequency of allele combination: Aa (heterozygous) Frequency of allele: a Frequency of allele combination: aa (homozygous recessive) Frequency of allele: A (p + q)2 = p2 + 2pq + q2 = 1 Frequency of allele types Frequency of allele combinations
1 – frequency of the dominant phenotype How to Solve H-W Problems • The procedure for solving a Hardy-Weinberg problem is straightforward. • Use decimal fractions (NOT PERCENTAGES) for all calculations! • Determine what information you have about the population. In most cases, it is the percentage or frequency of the recessive phenotype (q2) or the dominant phenotype (p2 + 2pq). These provide the only visible means of gathering data about the gene pool. • The first objective is to find out the value of p or q. If this is achieved, then every other value in the equation can be determined by simple calculation. If necessary q2 can be obtained by: • Take the square root of q2 to findq • Determine p by subtracting q from 1 (i.e. p = 1 – q) • Determine p2 by multiplying p by itself (i.e. p2 = p x p) • Determine 2pq by multiplying p X q X 2 • Check the calculations by adding p2 + 2pq + q2: theseshould always equal 1. Dominant phenotype = p2 + 2pq Recessive phenotype = q2
A Worked Example • Around 70% of caucasian Americans can taste the chemical P.T.C. (the dominant phenotype). 30% are non-tasters (the recessive phenotype). • Frequency of the dominant phenotype = 70% or 0.7 • Frequency of the recessive phenotype = 30% or 0.3 • Recessive phenotype: q2 = 0.30 • therefore: q = 0.5477 (square root of 0.30) • therefore: p = 0.4523 (1 – 0.5477 = 0.4523) • Use p and q in the equation to solve any unknown: • Homozygous dominant: p2 = 0.2046 (0.4523 x 0.4523) • Heterozygous: 2pq = 0.4953 (2 x 0.4522 x 0.5477) • Frequency of homozygous recessive phenotype = q2 = 30% • Frequency of dominant allele (p) = 45.2% • Frequency of homozygous tasters (p2) = 20.5% and heterozygous tasters (2pq) = 49.5%
Activity • Biozone pages 311 to 315.