Download
1 / 30
300 likes | 425 Vues
Comparison of surface mass balance components simulated by LMDZ and MAR forced with LMDZ. Irina Gorodetskaya * , Hubert Gall é e, Gerhard Krinner Laboratoire de Glaciologie et G é ophysique de l’Environnement, Grenoble,France * Now at: Katholieke Universiteit Leuven, Belgium.

E N D
Comparison of surface mass balance components simulated by LMDZ and MAR forced with LMDZ Irina Gorodetskaya*, Hubert Gallée, Gerhard Krinner Laboratoire de Glaciologie et Géophysique de l’Environnement, Grenoble,France *Now at: Katholieke Universiteit Leuven, Belgium CHARMANT, LGGE 19 October, 2009
Vaughan et al. 1999 Giovinetto and Bentley 1985 SMB compilations 166 mmwe van den Berg et al. 2006: observations van den Berg et al. 2006: calibrated model 171 mmwe
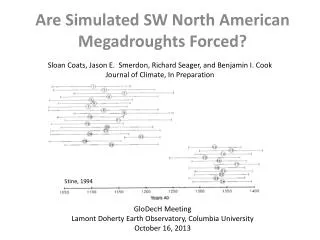
Changes in precipitation? Linear trends of annual snowfall accumulation (mm yr -1 decade -1) for 1955-2004 Monaghan et al 2008
Predicted precipitation change: LMDZ (IPSL) Precipitation change: 2081-2100 / 1981-2000 SIC changes: (2081-2100) - (1981-2000) Krinner et al. 2007, 2008
Large-scale model (ECMWF or GCM) Nesting: MAR forced with LMDZ output Mesoscale model (MAR)
Snow HCond FL T4 HLat FS HSen coupling to sea ice, land ice, vegetation... HMelt HFreez Blowingsnow FS Tsfc Liquid water Percolation Atmospheric model: mesoscale hydrostatic primitive equation model (Gallée 1994, 1995) • Terrain following vertical coordinates (normalized pressure) • Turbulence: 1 1/2 closure (Duynkerke 1988) • Bulk cloud microphysics (Kessler 1962 and Lin et al 1983 + improvements of Meyers et al. 1992 and Levkov et al. 1992) • Solar and infrared radiative transfer scheme (Morcrette 2002, Ebert and Curry 1992) • Snow fall included into infrared radiation scheme Snow model: conservation of heat and water (solid and liquid), description of snow properties (density, dendricity, sphericity and size of the grains), melting/freezing Blowing snow model (Gallée et al, 2001) Modèle Atmosphérique Régional (MAR) • Horizontal resolution 40 km • 33 vertical levels (lowest ~9m, one level each 10 m below 50 m; top = 10hPa) • Initial and boundary conditions: LMDZ4
Relative annual mean precipitation change: LMDZ (IPSL): 2081-2100 / 1981-2000 MAR (lmdz forced): 2082 / 1982 Krinner et al. 2007
Surface mass balance, mm w.e. 1981-1989 MAR (lmdz forced) LMDZ 42 mmwe 175 mmwe
Ratio between simulated SMB in S20 and estimates by Vaughan et al. 1999 Ratio between LMDZ-simulated SMB and observed SMB in selected locations Krinner et al. 2007
Snow fall Sublimation surface SMB components: LMDZ1981-1989 220 mmwe 17 mmwe Total melt Effective melt 29 mmwe units: mmwe
Sublimation surface Melt Snow fall minus erosion SMB components: MAR 1981-1989 14 mmwe 62 mmwe Sublimation drifting snow 7 mmwe 5 mmwe units: mmwe
LMDZ: 220 mmwe Annual snow fall, mmweDifference: MAR-LMZ1981-1989 MAR-LMDZ: -128 mmwe MAR: 62 mmwe
Blowing snow flux MAR : removal by wind erosion Snow fall minus erosion
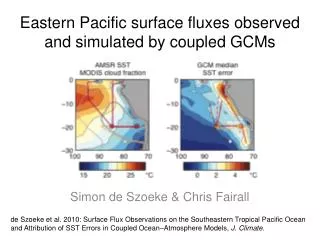
Surface sublimation/deposition ECMWF ERA-15, 1979-1993 Déry and Yau, 2002 MAR, 1981-1989: MEAN = 14 mmwe/yr MEAN = 14 mmwe/yr
Sublimation of drifting snow MAR, 1981-1989, Liu et al 1983 parametrization: ECMWF ERA-15, 1979-1993 Déry and Yau, 2002 MEAN = 6 mmwe/yr MEAN = 15 mmwe/yr
Ablation areas MAR SMB, mmwe/yr Ablation areas van den Broeke et al, 2006 AIS Blue = Blue ice areas > 10% (Winther et al. 2001) Red diam = meteorite sites
Conclusions • LMDZ and MAR : large differences in SMB • LMDZ: • large precipitation and large melt = compensate • only two processes: precip and surface sublimation • melt calculated offline • MAR: • snow fall is corrected for erosion = impossible to separate • lack of snow fall or too much erosion by wind • additional ablation processes: snow drift sublimation • melt is simulated • large local differences two models especially over the coasts • need more observations to tell which one is right
Surface mass balance from a GCM:Laboratoire de Meteorologie Dynamique general circulation model (LMDZ) 1981-2000 (S20) mmwe Krinner et al. 2007
SMB components: LMDZ 1981-2000 mmwe Sublimation/ deposition Precip Melt Krinner et al. 2007
Annual mean precipitation: MAR(lmdz forced) - LMDZ 1980-1985 LMDZ: only snow fall (no erosion) MAR: precip-erosion(blowing snow parameterization) mmwe
MAR validation : Dome C (ECMWF forcing) Surface air temperature over Dome C, East Antarctica Gallée and Gorodetskaya, Clim Dyn 2008
Model validation : South Pole (ECMWF forcing) Power spectrum (units2/time) Town, Gorodetskaya, Walden, Warren, in prep
Snow accumulation at South Pole (MAR forced with ERA-40) Integrated snow,mm.w.e Snow accumulation, mm.w.e warm events PSCs 54% 24% 7% 4% 11% Gorodetskaya, Town, Gallée, in prep 1994
MAR forced with LMDZ vs LMDZ itself : MAR - larger amplitude! r=0.6
Diff: 2082-1982 MAR forced with LMDZ SMB changes: from 1982 to 2082 Ratio: 2082/1982 mmwe
Relative annual mean precipitation change: LMDZ (IPSL): 2081-2100 / 1981-2000 MAR (lmdz forced): 2082 / 1982 Krinner et al. 2007
MAR forced with LMDZ Annual mean surface temperature change: 2082-1982 Precipitation change: 2082/1982 ratio
Annual mean sea ice concentration changeLMDZ [2081-2100] - [1981-2000] % Krinner et al. 2007