Download
1 / 20
200 likes | 263 Vues
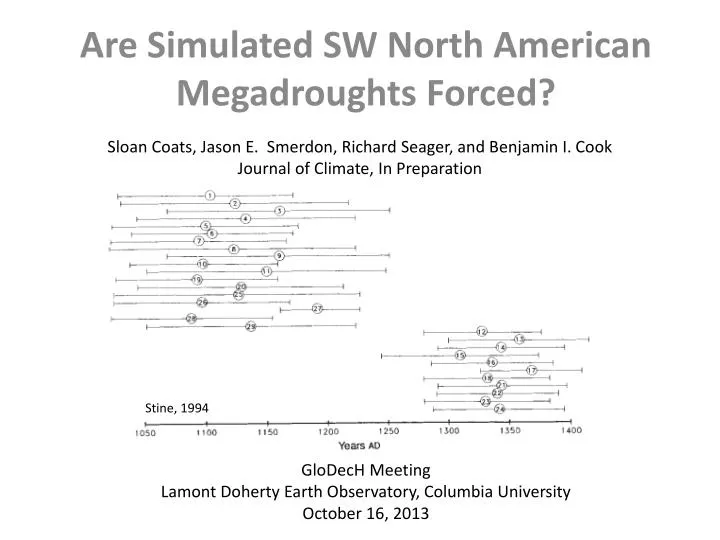
Sloan Coats, Jason E. Smerdon , Richard Seager , and Benjamin I. Cook Journal of Climate, In Preparation. Are Simulated SW North American Megadroughts Forced?. Stine, 1994. GloDecH Meeting Lamont Doherty Earth Observatory, Columbia University October 16, 2013.

E N D
Sloan Coats, Jason E. Smerdon, Richard Seager, and Benjamin I. Cook Journal of Climate, In Preparation Are Simulated SW North American Megadroughts Forced? Stine, 1994 GloDecH Meeting Lamont Doherty Earth Observatory, Columbia University October 16, 2013
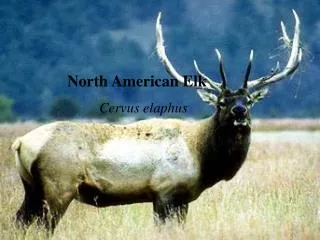
Why Southwestern North America? 16% of the U.S. population (U.S. Census Bureau, 2009). Half of domestic food crop production (Parker, 2007). Water supply is fickle and unpredictable(Schlenker et al., 2007). David McNew/Getty Images Last millenium has decadal to century scale “megadroughts”. Cook et al., 2009
Projecting Future Hydroclimate Drying trend over SW in median P-E for 24 IPCC AR4 Models Seager and Vecchi, 2010
But Tropical Pacific is dominant driver of SW hydro… IPCC AR4 …and there is little agreement in simulated future state of TP.
What do the observations say? La Niña-like trend in TPGR (1880-2005) Karnauskas et al., 2009 Obs TP trend (--) and Sim TP trend (--) within the magnitude of 125-year trends from simulated internal variability Karnauskas et al., 2012
What do model’s say? So are unforced megadroughts a robust model response and is that at all realistic? And how feasible is projecting future hydroclimate states?
Two Research Questions • Do state-of-the-art AOGCMs simulate megadroughts? • Are these driven by variations in the exogenous forcing conditions and/or the oceanic boundary conditions?
Methods: Creating a hydroclimate index • JJA PDSI from the NADA is ground truth. • JJA PDSI was calculated for models: • 6 forced LM simulations appended to historical simulations (0850-2005). • 2.5x2.5 lat-lon grid. • Net radiation and precipitation as inputs. • Hydroclimatetimeseries was created by averaging the PDSI over the Southwest region of NA (125°W-105°W, 25°N-42.5°N ).
Methods: Identifying drought • Droughts identified using the 2 start 2 end method from Coats et al., 2013a. • Droughts ranked using drought density method also from Coats et al., 2013a. • Top five are chosen for analysis of dynamics that drive persistent drought. • Results not dependent on “arbitrary” metric (Coats et al., 2013a).
Do models simulate megadroughts? Models simulate drought features that are characteristic (persistence and severity) of the proxy estimated megadroughts. There is a range in the characteristics of model simulated megadroughts (some models do better than others). No agreement in drought timing and no statistically significant correlations between PDSI timeseries. Paleoclimate estimated drought variability
Winter/Summer? Precip/Evap? Megadroughts result from anomalously low winter (DJF) precipitation over the SW. Pattern is characteristic of that driven by the La Niña.
ECHO-G simulations showed the same megadroughtprecip pattern, but it wasn’t forced by La Niña… CCSM model simulates megadroughts forced by the TP. **Statistically significant connection between megadroughts and a mode of variability at the 99% level using a distribution and auto-correlation preserving bootstrapping method.
Another angle: Composite 200mb DJF height anomaly during megadroughts Cross-hatching indicates that 4 of 5 identified droughts show the same sign anomaly as the composite at that gridpoint. Positive height anomaly is reminiscent of the pattern forced by La Niña.
Analysis of CCSM • What is happening in the TP during the identified megadrought periods? • Why does only the CCSM model exhibit a connection between megadroughts and the TP?
Mean state change or a change in TP variability? -Well documented physical mechanisms for mean state change in TP (Vecchi et al., 2011). Model’s have shown multidecadal modulation of ENSO variability (Wittenberg et al., 2006). -Megadrought periods in CCSM have approximately average Niño3.4 statistics. -Megadrought periods are consistent with a shift toward a more La Niña-like mean state.
Is the change in mean-state forced? First EOF of LP-filtered Temp over TP: CCSM Control —PC; —TPGR First EOF of LP-filtered Temp over TP: CCSM Forced —PC; —TPGR TPGR on multidecadal timescales in CCSM is consistent with the internal CPO mode of variability.
What is different about CCSM? Very strong, realistic and stationary teleconnection between SW and TP for CCSM!
Hypothesis Stochastic atmospheric variability (and internal modes of coupled atmosphere ocean variability outside of the TP)…can produce storm track shifts that are uninterrupted by tropical Pacific influence because of the weak (and non-stationary) ENSO teleconnection on multidecadal timescales… from Coats et al., 2013a Correlation between SW PDSI timeseries and SST for LM
Conclusions • Models simulate megadroughts that are characteristic of the paleo-proxy record. • These drought are not tied to changes in the exogenous forcing. • Atmosphere-only megadroughts are not a robust model characteristic. Models with strong, stationary teleconnections simulate TP driven persistent drought.
Discussion • If CCSM model behavior is characteristic of the actual climate system then regional hydroclimate is perhaps more predictable, though operational prediction of the TP has yet to exceed ~1 year. • We must better understand atmosphere only driven hydroclimate change as these models will be used to create future projections. • These types of analyses are an important addition to statistical rescaling of model output such as in Ault et al., 2012; 2013 (getting the right answer for the wrong reason—or vice versa).