Download
1 / 28
280 likes | 373 Vues
Evolution and future projections of the urban heat island at the coastal urban area of Athens. D. Founda 1 , C. Giannakopoulos 1 , M. Hatzaki 1 , M. McCarthy 2 , C. Goodess 3 , D. Hemming 2 , and F. Pierros 1

E N D
Evolution and future projections of the urban heat island at the coastalurban area of Athens D. Founda1, C. Giannakopoulos1, M. Hatzaki1, M. McCarthy2, C. Goodess3, D. Hemming2, and F. Pierros1 1Institute of Environmental Research and Sustainable Development, National Observatory of Athens, Greece 2Met Office Hadley Centre, UK 3Climatic Research Unit, School of Environmental Sciences, University of East Anglia, UK
Air temperature trends in Athens • Athens is a large urban area of eastern Mediterranean that experiences both global warming and urbanization effects • According to the historical records of the National Observatory of Athens (NOA), the annual air temperature in Athens reveals a statistically significant positive trend from the beginning of the past century till now • This is due to the increase of the summer rather than the winter temperature • The increase of the maximum temperature in summer during the last few decades (since the mid 1970’s) is significantly large and amounts roughly to 1°C/decade • Summer 2007 was an exceptionally hot summer in Athens, with three severe heat waves and an all time record value in the maximum temperature (44.8°C at NOA)( Founda & Giannakopoulos 2009) • However, summer 2012 (June – August) was the warmest summer ever recorded at NOA as regards the mean maximum and minimum air temperature
Mean summer temperature at NOA (1897-2010) Trends 1897-2010: + 0.16°C/decade, or ~ 1.8°C Trends 1976-2010: +0.9°C/decade, or ~ 3°C
Mean winter temperature at NOA (1897-2010) Trends 1897-2010: +0.02°C/decade, or ~ 0.22°C Trends 1976-2010: +0.15°C/decade, or ~ 0.5°C
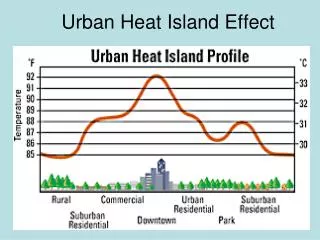
Global warming orurbanization? • global climate responds to the radiative forcing and feedbacks resulting from emissions of greenhouse gases • regional climates further respond to drivers as land-use change, agriculture, deforestation, and irrigation • localised micro-climates can develop as a result of immediate human activity and settlements • most apparent and widely known expression of this is the urban heat island (UHI) effect: measurably warmer urban areas than surrounding rural environments • UHI intensity: • reflected by temperature differences between urban and rural sites • depends on the size, population and industrial development of a city, topography, regional climate and meteorological conditions
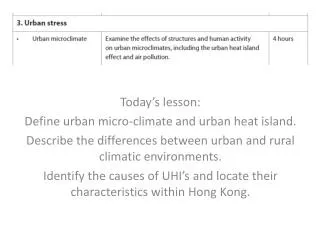
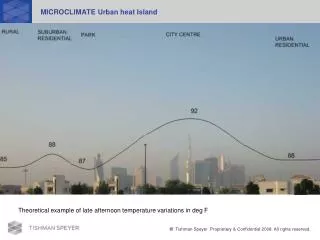
Urban heat island • should be considered on three different scales • First, there is the mesoscale of the whole city • Second is the local scale on the order of the size of a park • Third scale is the microscale of the garden and buildings near the meteorological observing site Of the three scales the microscale and local-scale effects generally are larger than mesoscale effects
Urban heat island in Athens – previous research • UHI in Athens is of the order of 4-5°C between urban and suburban stations (Livada et al. 2005) • But UHI can be of the order of 10°C between rural stations and the central zone of the city • Significant research on spatial variability of UHI in Athens, but… • Studies concerning the rates of changes of UHI over time are missing • It is important to know whether the intensity of the urban heat island in the city continues to amplify, if it hasmoderated or has stabilized
Selected Stations NOA ► urban in a park (unchanged environment local and microscale) Helliniko (HEL) ► urban coastal Tatoi (TAT) ► rural – suburban Tanagra (TAN) ► rural (airport) Aliartos (ALI) ► rural Elefsis (ELE) ► suburban (industrial) NOA represents the ‘background’ urban conditions in Athens on the mesoscale
Summer maximum temperature NOA (urban) and HEL (coastal urban) stations Similar trends at NOA and HEL
Summer average, maximum and minimum temperatures at two urban and two rural stations
Summer UHI Temporal Variation and Trends UHI (Turban –Trural) UHI (Turban – Tsuburban)
Winter temperature at NOA (urban) and HEL (coastal urban) stations Similar trends (no statistical significant trend)
Winter UHI Trends UHI (Turban –Trural) UHI (Turban –Trural) UHI (Turban – Tsuburban)
Results on Athens UHI temporal evolution Summeraverage air temperature trends after 1976 at two urban stations in Athens are of the order of 1°C/decade UHI in summer increases at a rate of the order of 0.4°C /decade (urban-rural) or 0.2°C/decade (urban-suburban) Roughly 60% of warming is due to global warming and the rest 40% is due to urban effect Winteraverage air temperature after 1976 at two urbanstations in Athens reveal no significant trend. UHI in winter, increases at a rate of the order of 0.2°C/decade (urban-rural) or 0.1oC/decade (urban-suburban).
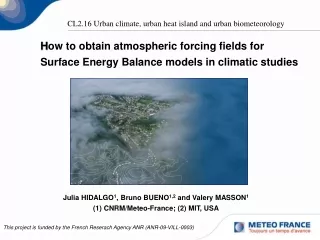
Model simulations A novel climate model that includes a sub-grid urban land-surface model was applied for an integrated impacts assessment for the Athens urban case study ► in order to quantify the cumulative impact and relative importance of • climate change and • urban heat island to the exposure of urban populations to temperature extremes as it is essential to consider the combined role of global warming and local urban warming
Urban Heat Island Simulations Urban fraction is set to zero HadRM3 modified to include MOSES 2.2 land-surface scheme and urban parameterisation ► “tiled” surface The "tiles" allow sub-grid variations Nine extracted gridcells over and surrounding the tree cities Fully coupled urban model Fully coupled urban model including additional anthropogenic term As UrbAnth, but with tripled anthropogenic heat flux Surface tile scheme, representing land surface exchanges within a single model gridcell
Urban Heat Island Simulations – gridcells Gridcells organised as: 1 2 3 4 5 6 7 8 9 cell 5 represents the city centre location and 1,2,3,4,6,7,8,9 are surrounding
Climate model bias • Larger RMSE for coastal points than for neighboring inland points, suggesting coastal influence on the apparent model bias
Urban Tile Temperatures - Athens RMSE 2.44 2.09 1.74 RMSE 1.50 1.54 1.49 Intra-annual cycle of Tmin and Tmax (upper panels) for NoUrbNoAnth, UrbNoAnth, UrbAnth simulations and observations and the differences (lower panels) between simulations and observations, using urban tile temperatures, between 1971-1990.
Gridcell mean temperatures - Athens RMSE 4.34 2.74 2.42 RMSE 4.34 2.74 2.42 RMSE 1.48 1.51 1.39 RMSE 1.48 1.51 1.39 Intra-annual cycle of Tmin and Tmax (upper panels) for NoUrbNoAnth, UrbNoAnth, UrbAnth simulations and observations and the differences (lower panels) between simulations and observations, using gridcell mean temperatures, between 1971-1990.
Urban model bias – Athens case • greatest impact of anthropogenic waste heat on the UHI during winter • during summer, it becomes a small term relative to the solar forcing
Summer Daytime/Nocturnal UHI UHIurban-rural UHIurban-rural UHIurban-suburban
Winter Daytime/Nocturnal UHI UHIurban-rural UHIurban-rural UHIurban-suburban
Future Projections of UHI for summer UHIurban-rural UHIurban-rural UHIurban-suburban
Future Projections of UHI for winter UHIurban-rural UHIurban-rural UHIurban-suburban
Model Results The analysis of the influence of the urban land surface and urban anthropogenic heat emissions for Athens showed that: • the main characteristics of a Mediterranean UHI captured by a simple urban surface exchange scheme, when compared observational data for Athens • temperature changes in response to an SRES A1B scenario by the 2050s are similar for urban and nonurban surfaces • future climate change will affect the urban and rural areas as well • future UHI responds to changes in the additional driver of anthropogenic heat emissions of a city
Thank you for your attention! The model simulations were performed within the context of EU-FP6 project CIRCE Integrated Project-Climate Change and Impact Research: the Mediterranean Environment (http://www.circeproject.eu).