Download
1 / 89
1.35k likes | 2.52k Vues
GIS in the Sciences ERTH 4750 (38031). Geographic Information and Spatial Data Types. Xiaogang (Marshall) Ma School of Science Rensselaer Polytechnic Institute Tuesday, January 29, 2013. Review of last week’s work. In the lecture Definition of Geographic Information System

E N D
GIS in the Sciences ERTH 4750 (38031) Geographic Information and Spatial Data Types Xiaogang (Marshall) Ma School of Science Rensselaer Polytechnic Institute Tuesday, January 29, 2013
Review of last week’s work • In the lecture • Definition of Geographic Information System • Concepts of Data, Information, Geospatial data • GPS, RS, Database, GIS • In the lab • MapInfo Professional environment • Data Input: default formats, external file formats • Create points: geocode, coordinates • Questions?
Acknowledgements • This lecture is partly based on: • Augustijn, E.-W., 2009. Geographic information and spatial data types. E-lecture of the Distance Course Principles of GIS. ITC, Enschede, The Netherlands • Huisman, O., de By, R.A. (eds.), 2009. Principles of Geographic Information Systems. ITC Press, Enschede, The Netherlands
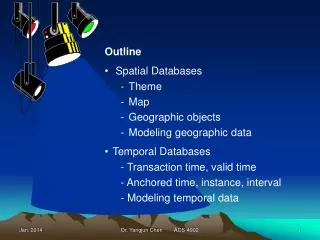
Outline • Geographic phenomena • Computer representations • Autocorrelation and topology • Representations for fields and objects • The temporal dimension
1 Geographic phenomena Land use type Shoreline Soil type • Geographic phenomena are the study objects of a GIS. • The real world is complex. A certain spot contains many different phenomena. • Different phenomena require different digital representations and multiple representations are possible for a same phenomenon. Water temperature Surface rock type Water body Lake Mendota Elevation Tourism site Water quality
1 Geographic phenomena • A digital representation is a model. It is not the real thing itself. • Our representation will never be perfect, some facts will not be found. “Essentially, all models are wrong, but some are useful.”-- Empirical Model-Building and Response Surfaces (1987) by George E. P. Box and Norman R. Draper
1 Geographic phenomena • This lecture studies geographicphenomena more deeply, and looks into different types of computerrepresentations for them.
1.1 Geographic phenomenon defined • A geographic phenomenon is something of interest that: • Can be named or described • Can be geo-referenced • Can be assigned a time (interval) at which it is/was present Description: Winslow Building Georeference: LatLng(42.73091, -73.68425) Built in: 1886
1.2 Different types of phenomena • There are two groups of geographic phenomena, fields and objects: • A (geographic) fieldis a geographic phenomenon for which, for every point in the study area, a value can be determined (e.g., temperature, barometric pressure and elevation) • (Geographic) objectspopulate the study area, and are usually well distinguishable, discrete, bounded entities. The space between them is potentially empty (e.g., buildings, rivers)
1.2.1 Field • Elevation is an example of field • You can measure the height everywhere
1.2.1 Field • There are two types of geographic fields, discrete fields and continuous fields • In a continuous field, the underlying function is assumed to be continuous. Continuity means that all changes in field values are gradual. (for example elevation) • Discrete fields cut up the study space in mutually exclusive bounded parts, with all locations in one part having the same field value. (for example land use)
1.2.1 Field • Continuous fields • Continuous means that all changes in field values are gradual • In a differentiable field we can measure the change • In the example on the left, we can measure the gradient (slope) as the change of elevation
1.2.1 Field • Discrete fields • Discrete fields cut up the study space in subparts with a clear boundary, with all locations in one part having the same value • Typical examples are land classifications, geological classes, soil types, land use types, crop types or natural vegetation types
1.2.2 Objects • Objects are discrete and bounded entities • The space between the objects is potentially ‘empty’ or ‘undetermined’ Three rocks (objects), in between no rocks (empty)
1.2.2 Objects • The position of an object in space is determined by a combination of one or more of the following parameters • Location (where is it?) • Shape (what form?) • Size (how big?) • Orientation (direction) A bridge is an object, with a location, shape, size (length of the bridge) and a direction (maybe north –south)
1.2.2 Objects • We usually do not study objects in isolation (a single object) but whole collections of objects • Observe that collections of objects can be interesting phenomena at a higher aggregation level: • Forest plots form forests • Parcels form blocks and blocks form suburbs • Streams, brooks and rivers form a river drainage system We can study each individual tree, or the combination of trees, as one object
1.3 Boundaries • Both objects and discrete fields have boundaries • Two different types of boundaries: • Crisp boundaries • Fuzzy boundaries
1.3.1 Crisp boundaries • A crisp boundary is one that can be determined with almost arbitrary precision • As a general rule of thumb, crisp boundaries are more common in man-made phenomena
1.3.2 Fuzzy boundaries • Fuzzy boundaries contrast with crisp boundaries in that the boundary is not a precise line, but rather an area of transition
2 Computer representations • Computer representations can be divided into two groups: tessellations and vector-based representations • The next step is to understand how the computer representations can be applied to represent geographic fields and objects
2.1 Tessellations • A tessellation is a partition of space into mutually exclusive cells that together make up the complete study area • There are two groups of tessellations: • Regular tessellations, the cells are the same shape and size • Irregular tessellations, the cells vary in shape and size
2.1.1 Regular tessellations • All regular tessellations have in common that the cells are of the same shape and size, and the field attribute value assigned to a cell is associated with the entire area occupied by the cell Reality Regular tessellation
2.1.1 Regular tessellations • The size of the area that a single raster cell represents is called the raster’s resolution
2.1.1 Regular tessellations • Some convention is needed to state which value prevails on cell boundaries • Lower and left boundaries belong to the cell
2.1.1 Regular tessellations • When we represent a continuous field, values are changing constantly • In a regular tessellation each cell has only one value, that represents the total area of a cell (e.g., average elevation) • There will be a continuity gap between adjacent cells
2.1.1 Regular tessellations Make the cell size smaller • Two ways to improve on this continuity issue: • Make the cell size smaller • Assume that the cell value only represents one specific location and provide a good interpolation function for all other locations
2.1.1 Regular tessellations • A raster stores a long list of values, one for each cell preceded by a small list of extra data (called header file) that informs how to interpret the list of values
2.1.1 Regular tessellations Dark blue line indicates the order of cell values in the cell value list • The values in the list can be ordered in different ways. • The header file will indicate which space filling schema has to be used. • Examples of space filling curves: row order, row-prime order, Morton (Z) and Peano-Hilbert order (a) Row order, (b) row-prime order, (c) Morton (z) order, (d) Peano-Hilbert order
2.1.1 Regular tessellations • Disadvantages of regular tessellation: • Not adaptive to the spatial phenomenon we want to represent. No matter how many cells have the same value, it will store this value for every cell • Advantages of regular tessellation: • We know how they partition space • We can make computations specific to this partitioning • Fast algorithms
2.1.2 Irregular tessellations • Besides regular tessellations, there are also irregular tessellations: • Partition space into mutually disjoint cells • Cells vary in size and shape • Adapts to spatial phenomena • Example: quadtree Regular tessellation Irregular tessellation: Quadtree
2.1.2 Irregular tessellations Only one value: quadrant is not split further • Quadtree: • The area is split into four quadrants until parts have only a single field value Multiple values, continue splitting
2.1.2 Irregular tessellations Cell size: 100 x 100 m • Quadtrees have various interesting characteristics for example, square nodes at the same level represent equal area sizes. This allows quick computation 160000 m2 40000 m2 10000 m2
2.2 Vector representations • Besides tessellations (raster representations) we can also store our geographical phenomena in a vector representation • We discuss the difference between raster and vector representations • We discuss different types of vector representations
2.2 Vector representations • In vector representations, a georeferenceis explicitly associate with the geographic phenomena • A georeferenceis a coordinate pair from some geographic space, also known as a vector Vector y1 y2 y3 x2 x3 x1
2.2 Vector representations Raster • Tessellations do not explicitly store georeferences of the phenomena. They provide a georeference of the lower left corner and the resolution • The georeference of all other cells can be derived from this information georeference
2.2 Vector representations • We will discuss the following vector representations: • Triangulated Irregular Networks (TIN) • Point representations • Line representations • Area representations
2.2.1 Triangulated Irregular Networks • A TIN is built from a set of measurements for example points of height • These points can be scattered unevenly over the study area, with areas of more change having more points • Triangles are fitted through three points to form planes
2.2.1 Triangulated Irregular Networks Delaunay triangulation • There are many triangulations possible for the same input dataset • The best triangulations are Delaunay triangulations which have the following properties: • Triangles are as equal sided as possible • The circumcircle through the anchor points of a triangle does not contain any other anchor points Other triangulation
2.2.1 Triangulated Irregular Networks No value is stored for this plane • A Tin is a vector representation and not an irregular tessellation because: • Each anchor point has a stored georeference • The planes do not have a stored values (like raster cells have) A georeference and value is stored for each anchor point
2.2.1 Triangulated Irregular Networks • Each plane fitted through three anchor points has a fixed gradient (Slope)
2.2.1 Triangulated Irregular Networks • Each plane fitted through three anchor points has a fixed aspect • An aspect is the orientation of the slope, for example Northwest or Southeast
2.2.2 Points • Another vector representation are points • Points are defined as single coordinate pairs (x,y) when we work in 2D or coordinate triplets (x,y,z) when we work in 3D • Points are best used to represent objects that are best described as shape- and sizeless, single-locality features Points representing trees along a road
2.2.3 Lines • Line representations: • Used to represent one-dimensional objects (e.g., roads, railroads, canals, rivers…) • Line is defined by 2 end nodes and 0-n internal nodes to define the shape of the line. • An internal nodeor vertexis like a point that only serves to define the line Begin node Vertex Line or arc End node
2.2.4 Areas • Area representations: • When area objects are stored using a vector approach, the usual technique is to apply a boundary model • The area is defined by the boundary of the area You store the boundary of the area
2.2.4 Areas • A simple but naïve representation of area features would be to list for each polygon the list of lines that describes its boundary. This is called a polygon-by-polygon representation • Each line in the list would be a sequence that starts with a node and ends with one Total boundary of the polygon
2.2.4 Areas • The reason why this is not a good representation is called data redundancy • This means that shared boundaries between polygons are stored double When store the second boundary, some line segments are duplicated
2.2.4 Areas Line 4 Line 3 • The boundary model or topological data model is an improved representation of the polygon-by-polygon model • It stores parts of a polygon’s boundary as separate line segments Line 2 Line 1
2.2.4 Areas • It also indicates which polygon is on the left and which is on the right of each arc 8 ZZ XX 9 15 Line I Line O 10 Line N QQ Line P 14 12 13
2.2.4 Areas • We can determine the left and the right polygon, because the line segment has a direction • The direction of the line segment is from the “From node” to the “To node” 8 ZZ XX 9 15 Line I Line O 10 Line N QQ Line P 14 12 13 From node 15 Left Right To node 13