Download
1 / 32
320 likes | 440 Vues
Mapping Interactions Within the Evolving Science of Science and Innovation Policy Community . Angela M. Zoss and Dr. Katy Börner Cyberinfrastructure for Network Science Center Information Visualization Laboratory School of Library and Information Science

E N D
Mapping Interactions Within the EvolvingScience of Science and Innovation Policy Community Angela M. Zoss and Dr. Katy Börner Cyberinfrastructure for Network Science Center Information Visualization Laboratory School of Library and Information Science Indiana University, Bloomington, IN http://cns.iu.edu 13th Conference for the International Society for Scientometrics and Informetrics Durban, South Africa; July 4-7, 2011 July 6, 2011
Science of Science & Innovation Policy (SciSIP) program at the National Science Foundation (NSF) • Aim is to fund projects that develop, improve and expand models, analytical tools, data and metrics that can be directly applied in the science policy decision making process. • At time of study, 162 active and expired awards (now 185) • SciSIP Listserv: • active since January 2009 • in January 2011 there were almost 700 subscribers To subscribe to the listserv, send a blank email to SUBSCRIBE-SCISIP@LISTS.NSF.GOV
Problems Mapping Growing Communities • Traditional network analysis methods use publication data • Low availability of publication data during the early stages (ongoing research, publication lag) • Inconsistent connections between funding sources and publications • Doesn’t capture informal knowledge networks across institutional and national boundaries or the agency of individuals who do the work of connecting data silos, both of which influence community growth • Supplementing traditional data sources with data on informal communication patterns (e.g., listserv messages) can contextualize and provide more detail for traditional community mapping studies.
Research Questions • What interactions are made visible by analysis of formal communication channels like awards and publications? • How can analysis of informal communication supplement traditional analysis techniques? • What roles do researchers play in the various interaction networks?
Data Sets • Award and publication data (retrieved Jan. ‘11) • Metadata for 162 active and expired awards, totaling $81 million • Metadata for 56 publications, associated with 22 of the awards • Listserv data • 919 messages over 2 years (Jan. ‘09 to Jan. ‘11) • Subscription lists, retrieved toward the middle and end of the sampling period
Publication Data • 56 publications, associated with 22 of the awards
Listserv Data • Subscribers: • 3 subscription lists showing 475 (2/21/10), 659 (12/18/10), and 674 (1/10/11) members • After merging subscribers and senders, total of 728 participating individuals • Messages: • 919 messages from 199 senders • 426 threads started; 104 received a response (avg. length of multi-message thread: 5.74)
Coding Listserv Data • Participants • Affiliation (com+, edu+, gov+, org+) • Country • Messages • Date • Sender • Thread • For thread initiations • Type of message • Ability to generate response
Message Type • Analysis uncovered four major message types: • announcement of a resource (e.g., papers, tools, websites) or event (e.g., conference, workshop) of interest • request for submissions to a formal solicitation(e.g., CFP, RFA) • request for feedback or input on a posed question or topic (e.g., looking for literature on a particular subject) • other(e.g., subscription attempts, technical matters)
Ability to Elicit Response Affiliation of Sender Type of Message
resource or event of interest request for submissions request for feedback other resource or event of interest request for submissions request for feedback other
Open Questions & New Directions • Evaluation of results using expert interpretation • Ways to automate analysis of informal communication? • Other ways to capture structure and dynamics of new/growing communities? • Ways to incorporate additional temporal, geospatial, and topical information?
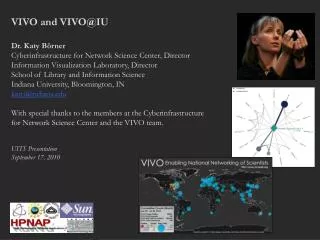
VIVO: A Semantic Approach to Creating a National Network of Researchers (http://vivoweb.org) • Semantic web application and ontology editor originally developed at Cornell U. • Integrates research and scholarship info from systems of record across institution(s). • Facilitates research discovery and cross-disciplinary collaboration. • Simplify reporting tasks, e.g., generate biosketch, department report. Funded by $12 million NIH award. Cornell University: Dean Krafft (Cornell PI), Manolo Bevia, Jim Blake, Nick Cappadona, Brian Caruso, Jon Corson-Rikert, Elly Cramer, Medha Devare, John Fereira, Brian Lowe, Stella Mitchell, Holly Mistlebauer, Anup Sawant, Christopher Westling, Rebecca Younes. University of Florida: Mike Conlon (VIVO and UF PI), Cecilia Botero, Kerry Britt, Erin Brooks, Amy Buhler, Ellie Bushhousen, Chris Case, Valrie Davis, Nita Ferree, Chris Haines, Rae Jesano, Margeaux Johnson, Sara Kreinest, Yang Li, Paula Markes, Sara Russell Gonzalez, Alexander Rockwell, Nancy Schaefer, Michele R. Tennant, George Hack, Chris Barnes, Narayan Raum, Brenda Stevens, Alicia Turner, Stephen Williams. Indiana University: Katy Borner (IU PI), William Barnett,Shanshan Chen, Ying Ding, Russell Duhon, Jon Dunn, Micah Linnemeier, Nianli Ma, Robert McDonald, Barbara Ann O'Leary,Mark Price, Yuyin Sun, Alan Walsh, Brian Wheeler, Angela Zoss.Ponce School of Medicine: Richard Noel (Ponce PI), Ricardo Espada, Damaris Torres.The Scripps Research Institute: Gerald Joyce (Scripps PI), Greg Dunlap, Catherine Dunn, Brant Kelley, Paula King,Angela Murrell, Barbara Noble, Cary Thomas, Michaeleen Trimarchi.Washington University, St. Louis: Rakesh Nagarajan (WUSTL PI), Kristi L. Holmes, Sunita B. Koul, Leslie D. McIntosh.Weill Cornell Medical College: Curtis Cole (Weill PI), Paul Albert, Victor Brodsky, Adam Cheriff, Oscar Cruz, Dan Dickinson, Chris Huang, Itay Klaz, Peter Michelini, Grace Migliorisi, John Ruffing, Jason Specland, Tru Tran, Jesse Turner, Vinay Varughese.
Temporal Analysis (When) Temporal visualizations of the number of papers/funding award at the institution, school, department, and people level 25
Topical Analysis (What) Science map overlays will show where a person, department, or university publishes most in the world of science. (in work) 26
Network Analysis (With Whom?) Who is co-authoring, co-investigating, co-inventing with whom? What teams are most productive in what projects? 27
Science is global. World view of VIVO activity. Web site visits are aggregated at the country level. 02/2010 Geospatial Analysis (Where) Where is what science performed by whom? Science is global and needs to be studied globally. (in work) 28
Shown are the - Number of people profiles in the 7 different VIVO installation sites plus CAS and U Melbourne. - Email contacts by data and service providers as well as institutions interested to adopt VIVO. - The number of visitors on http://vivoweb.org Circles are area size coded using a logarithmic scale. 04/2010 29
VIVO 1.0 source code was publicly released on April 14, 2010 87 downloads by June 11, 2010. The more institutions adopt VIVO, the more high quality data will be available to understand, navigate, manage, utilize, and communicate progress in science and technology. 06/2010 30
Second Annual VIVO Conference August 24-26, 2011 Gaylord National, Washington D.C. http://vivoweb.org/conference VIVO is supported by NIH Award U24 RR029822