SvPablo: Performance Instrumentation Tool for C and HPF Programs
SvPablo is a GUI-based tool for instrumenting source code and analyzing runtime performance data. Developed through collaborative efforts at the University of Illinois and Rice University, it enables automatic instrumentation of HPF programs using the PGI HPF compiler, as well as interactive instrumentation for C programs. The tool generates performance data in SDDF format, capturing metrics such as duration and message exchanges. With comprehensive support for performance contexts, users can effectively analyze application behavior, facilitating optimization and debugging.

SvPablo: Performance Instrumentation Tool for C and HPF Programs
E N D
Presentation Transcript
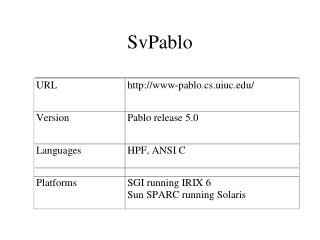
SvPablo • Source view Pablo • GUI for instrumenting source code and viewing runtime performance data • Joint work at Univ. of Illinois and Rice Univ. • HPF programs automatically instrumented by PGI HPF compiler • C programs interactively instrumented using GUI • Fortran 77/90 parser developed at JPL
SvPablo Project • Set of application source files • One or more performance contexts • Performance context includes • instrumentation specification - source code points where performance measurements are to be inserted • set of performance data files in SDDF, generated when instrumented code is run • Source files and parser options are shared among all contexts.
Project Menu Selections • New Project • Open Project • Edit Project • Select Project Base Directory • Load Color Configuration • Exit SvPablo
Instrumentation of HPF Programs • Given appropriate flags, the PGI HPF compiler automatically inserts calls to SvPablo instrumentation library routines at the beginning and end of every procedure and for each executable line. • After compiling and linking with the SvPablo HPF trace library, the user runs the instrumented executable which generates per-process trace files. • User runs HPFCombine to merge per-process trace files into a single performance file SDDF format.
Compiling and Linking Compile with pghpf flag -Mprof=lines to active calls to the SvPablo HPF trace library: % pghpf -c -Mprof=lines part1.F % pghpf -c -Mprof=lines part2.F Link with flag -Mprof=lines to activate calls to both theSvPablo HPF trace library and the PGI profiler library. Link with flag -Mprof=stats to activate only calls to the SvPablo HPF trace library: % pghpf -Mprof=stats part1.o part2.o /usr/local/SvPablo/lib/pghpf2SDDF.o
Procedure Metrics • Count • Exclusive Duration • Inclusive Duration • Send Msg Duration • Receive Msg Duration
Line Metrics • Count • Duration • Exclusive Duration • Message Send Duration • Message Send Count • Message Send Size • Message Receive Duration • Message Receive Count • Message Receive Size
Performance Statistics • Performance file contains the following statistics for the procedure and line performance metrics: • mean • standard deviation • minimum value • process corresponding to minimum value • maximum value • process corresponding to maximum value
Instrumentation of C Programs • Use GUI to instrument selected constructs in C source files • Compile instrumented source files and link with SvPablo C Trace Library • Run instrumented executable • Combine per-process trace files using CCombine
Files Created By Saving Instrumentation • Each instrumented file is saved as <file name>.<inst directory>.inst.c • The following files are saved in the instrumentation directory: • InstrumentationInit.c, containing the new main function for the instrumented program • projectHistory file, containing information for the parser and for CCombine • a configuration file named <file name>.c.config for each instrumented file, containing the instrumented points used by the GUI
Compiling and Linking % cc -64 -c file1.Context1.inst.c % cc -64 -c file2.Context1.inst.c % cc -64 -c Context1/InstrumentationInit.c % cc -64 -o app file1.Context1.inst.o file2.Context2.inst.o \ InstrumentationInit.o /usr/local/SvPablo/lib/cTrace.o \ /usr/local/SvPablo/lib/svPabloLib_MPI.o -L/usr/lib64/libmpi.so -lmpi