Download
1 / 15
150 likes | 242 Vues
Explore how SvPablo enhances performance analysis of climate codes with graphical environment, source code instrumentation, data capture, and analysis. Find support for F77/F90 and C languages, optional hardware counter data, and real-time data transmission.

E N D
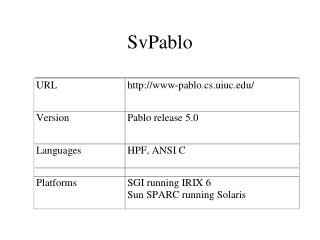
Instrumenting Climate Codes with SvPablo Celso Mendes Ying Zhang Daniel Reed Pablo Research Group Department of Computer Science University of Illinois at Urbana-Champaign http://www-pablo.cs.uiuc.edu
SvPablo Overview Pablo Research Group - Department of Computer Science - UIUC • Graphical performance analysis environment • source code instrumentation • performance data capture, browsing & analysis • F77/F90 and C language support • Performance data capture features • software-based instrumentation (default) • hardware performance counter data optional - PAPI • statistical summaries for long-running codes (no traces) • option for real-time data transmission via Autopilot • Supported platforms • Sun Solaris, IBM SP, SGI Origin, HP/Compaq Alpha • Linux (IA-32 and IA-64) • installed at NCSA, NERSC, …
SvPablo Components Pablo Research Group - Department of Computer Science - UIUC Instrumented source code Virtue time tunnel display Autopilot Lib PAPI Lib GUI Compiler AP sensor data collector SvPablo data capture library Source Code Instrumentation Instrumented object code Source Code Per-task performance files Linker Execution on parallel architecture Performance data visualization Instrumented executable Performance file SvPabloCombine
Tests with POP Code Pablo Research Group - Department of Computer Science - UIUC • Environment • POP code Version 1.4.3 • platform: IBM-SP3 (seaborg) • compiler options: –O3 –qcache=auto –qhot –qalias=noaryovrlp • Problems with original (non-instrumented) code • exit due to no convergence at early timesteps • could not test some configurations (e.g. P=32) • original timers in the code not properly configured • Test configurations • grid 320x384x40x2, 16 processors, 20 timesteps • grid 3600x2400x40x2, 64 processors, 10 timesteps
SvPablo GUI – POP 320x384 Pablo Research Group - Department of Computer Science - UIUC Menu bar List of contexts List of source files List of routines in a source file List of routines in performance file Source file display Critical routine
Second Execution: 3600x2400 Pablo Research Group - Department of Computer Science - UIUC • Instrumentation • inserted inside • baroclinic_driver Critical routines durations • Only 10 timesteps executed • (due to convergence error) counts
Third Execution: 3600x2400 Pablo Research Group - Department of Computer Science - UIUC • Instrumentation • inserted inside • clinic and • tracer_update Critical routines PAPI metrics
Performance Statistics by Line Pablo Research Group - Department of Computer Science - UIUC Across tasks Captured metrics Request more details…
Per-Task Statistics for Line Pablo Research Group - Department of Computer Science - UIUC
Selection of PAPI Metrics Pablo Research Group - Department of Computer Science - UIUC • config-file read at runtime: svpabloHWevents • example of contents • number of physical counters • Intel IA-32: 2 • Intel IA-64: 4 • IBM-SP: 8 2 21 native# L2 Load Misses# L2 Load Misses# 8 2 native# Burst L2 Load Misses# Burst L2 Load Misses# 4 19 native# Lost Cycles Waiting Load# Lost Cycles Waiting Load# 5 5 native# FPU0 Flop Oper# FPU0 Flop Oper# 0 0 PAPI_L1_LDM# L1 Load Misses# L1 Load Misses# 0 0 PAPI_LD_INS# Load Instructions# Load Instructions# 0 0 PAPI_TOT_CYC# Total Cycles# Total Number of Cycles#
Performance of Critical Routines Pablo Research Group - Department of Computer Science - UIUC • L2 miss ratios: • advu: 5.98% • hdiffu: 5.80% • % of lost cycles: • advu: 68.0% • hdiffu: 81.7%
Focus of Ongoing POP Analysis Pablo Research Group - Department of Computer Science - UIUC • Memory factor (e.g. advu, vertical) LUK = LUK + dz2r(k)*WUK*(UVEL(:,:,k-1,curtime) + & UVEL(:,:,k ,curtime)) • Communication factor • obtain communication costs in each major routine • use SvPablo + MPI profiling interface • Instrument lower-level routines • routines might be too fine-grained • use SvPablo + sampling
Communication Performance Data Pablo Research Group - Department of Computer Science - UIUC ( PCTM code ) Communication metrics PAPI metrics
PCTM/Ocean Communication Pablo Research Group - Department of Computer Science - UIUC
SvPablo Status and Directions • Currently under construction/integration • instrumentation of OpenMP constructs • capture and display of communication data • via MPI profiling interface • scalability analysis • cross-execution comparisons • application signature modeling and similarity comparison • power consumption analysis at application level • control of instrumentation overhead • Future directions • C++ instrumentation and analysis • Fortran parser replacement • more robust and extensible front-end