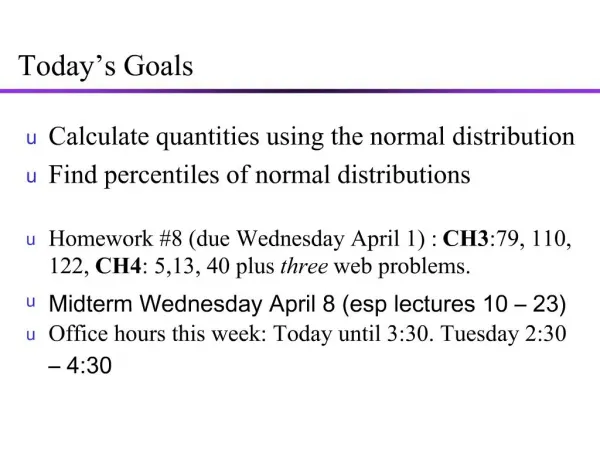
Today s Goals
Newspaper articles. Correlation versus causationWin-win situation on immigration"In states with a higher percentage of HB-1 visas, both immigrants and non-immigrants have more patent applications.What is the implication of the headline? What is causing what?. Newspaper articles. Correlation vers

Today s Goals
E N D
Presentation Transcript
1. Today�s Goals Calculate quantities using the normal distribution
Find percentiles of normal distributions
Homework #8 (due Wednesday April 1) : CH3:79, 110, 122, CH4: 5,13, 40 plus three web problems.
Midterm Wednesday April 8 (esp lectures 10 � 23)
Office hours this week: Today until 3:30. Tuesday 2:30 � 4:30
2. Newspaper articles Correlation versus causation
�Win-win situation on immigration�
In states with a higher percentage of HB-1 visas, both immigrants and non-immigrants have more patent applications.
What is the implication of the headline? What is causing what?
3. Newspaper articles Correlation versus causation
�Win-win situation on immigration�
In states with a higher percentage of HB-1 visas, both immigrants and non-immigrants have more patent applications.
What is the implication of the headline? What is causing what?
Headline implies that having more immigrant scientists and engineers is good for science: immigrants are causing better science
But, another possibility is that areas with active science communities are doing better economically and have more need to hire immigrants: better science leads to more immigrants.
4. Normal Probability Calculations Probability density function:
Theoretical range of X is -8 to +8.
The parameters of the Normal Distribution are the mean m and the standard deviation s.
5. Standard Normal The normal distribution with parameters 0 and 1 is called a standard normal distribution.
A random variable that has a standard normal distribution is called a standard normal random variable and will be denoted by Z.
The pdf of Z is:
7. Normal Probability Calculations: Standardization Then, we can use the standard tables
10. Standard Normal Tables (z-Tables)
12. Standard Normal Tables (z-Tables)
13. Reading the Table A.3 on page 740 The values of z are listed
down the rows (up to first decimal digit) and
across the top of the columns (second decimal digit).
The probability that Z is less than or equal to z is listed within the appropriate row.
14. Standard Normal Tables (z-Tables)
15. Example Resistors made by a certain manufacturer have resistances that are normally distributed with a mean of 9.9 ohms and SD of 0.1ohms. If the specification limits are 10 � 0.2 ohms, what fraction of the resistors conform to the specification limits?
X: resistance of a randomly selected resistor.
16. Solution Fraction conforming to specification limits:
Thus 84% of the resistors conform to the specification limits and 16% do not.
17. Percentiles The 100pth percentile is identified by the row and column in which the entry p appears.
18. Percentile To find the (100p)th percentile, find the value z that has probability of p.
Find the 30th percentile of the standard normal.
19. Percentile To find the (100p)th percentile, find the value z that has probability of p.
Find the 30th percentile of the standard normal.
20. Percentile To find the (100p)th percentile, find the value z that has probability of p.
Find the 30th percentile of the standard normal.
21. Percentiles The 100pth percentile is identified by the row and column in which the entry p appears.
What is the 99th percentile of X~N(50,20)?
We want the x such that p(X<x) = .99
22. Percentiles The 100pth percentile is identified by the row and column in which the entry p appears.
What is the 99th percentile of X~N(50,202)?
We want the x such that p(X<x) = .99
Translate to:
Find 99th percentile of Z: 2.33
(x-50)/20 = 2.33
x = 2.33 * 20 + 50 = 96.6
23. Percentiles The 100pth percentile is identified by the row and column in which the entry p appears.
What is the 99th percentile of X~N(50,202)?
We want the x such that p(X<x) = .99
Translate to:
Find 99th percentile of Z: 2.33
(x-50)/20 = 2.33
x = 2.33 * 20 + 50 = 96.6
In general: x(percentile) = z(percentile) * s + m
24. Percentiles The 99th percentile of Z is 2.33
p(Z < 2.33) = .99
What is the 1st percentile of Z?
25. Percentiles The 99th percentile of Z is 2.33
p(Z < 2.33) = .99
What is the 1st percentile of Z?
What is the 1st percentile of X ~ N(50,202)?
26. Percentiles The 99th percentile of Z is 2.33
p(Z < 2.33) = .99
What is the 1st percentile of Z? -2.33
What is the 1st percentile of X ~ N(50,202)?
x = -2.33*20+50 = 3.4
There is only a 1% chance that X is less than 3.4.
27. Example Test scores X ? N(? =500, ? =100).
What does your score have to be to assure that you are among the top 10%?
And to be among the top 5%?
How well have you done in relation to the others if your score is 750?
28. Solution Let's calculate the corresponding percentiles of the distribution:
Thus, you need at least a score of 628 to be among the top 10%.
29. Example Test scores X ? N(? =500, ? =100).
What does your score have to be to assure that you are among the top 10%?
And to be among the top 5%?
How well have you done in relation to the others if your score is 750?
30. Solution Let's calculate the corresponding percentiles of the distribution:
Thus, you need at least a score of 628 to be among the top 10% and at least 664.5 to be on the top 5%.
31. Example Test scores X ? N(? =500, ? =100).
What does your score have to be to assure that you are among the top 10%?
And to be among the top 5%?
How well have you done in relation to the others if your score is 750?
32. Example Now, your score of 750 corresponds to a standard value
2.5 standard deviations above the mean. Then, P(X < 2.5)=0.938 ? you are among the 6.2% top students.