Measuring Globalisation
Petra Vujakovic Joint Vienna Insitutute. Measuring Globalisation. A New Globalisation Index (NGI). Introduction. Why measure globalisation?. Quantify a very contended phenomenon and allow objective quantitative analysis Identify/quantify sources and impacts

Measuring Globalisation
E N D
Presentation Transcript
Petra Vujakovic Joint Vienna Insitutute Measuring Globalisation A New Globalisation Index (NGI)
Why measure globalisation? • Quantify a very contended phenomenon and allow objective quantitative analysis • Identify/quantify sources and impacts • Analysis and deeper understanding of the process • Analysis over time and across regions • Investigate links to other indicators – poverty, inequality, growth… „If you can not measure it, you can not improve it.“ Lord Kelvin
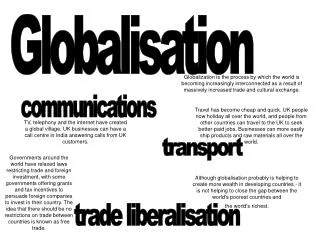
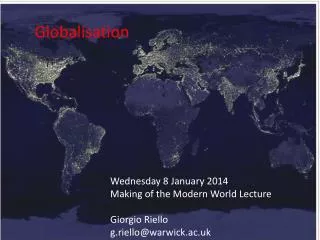
Defining Globalisation • Varied discussions in literature, no clear and commonly accepted definition. • The process of growing interdependence of economies, societies and nations across large distances.
Globalisation Indices - Overview • G-Index (World Markets Research Centre) • A.T. Kearney / Foreign Policy Globalization Index • KOF Globalization Index (ETH Zürich) • GlobalIndex (Transeurope-Project) • CSGR Globalisation Index (Warwick University) • Maastricht Globalization Index (Universiteit Maastricht)
Innovations in the NGI • 5 new variables • Introduction of distances • International trade in goods weighted with geographical distances globalisation vs. regional integration • Dimensions of globalisation generated through a statistical process • Search for indicators based on a priori defined theoretical spheres of globalisation • Grouping the indicators together with help of PCA – new dimensions or a confirmation of the theoretical ones?
Innovations in the NGI • 5 new variables • Introduction of distances • Dimensions of globalisation generated through a statistical process (PCA)
5 New Indicators • Portfolio stock • Trademark applications by non-residents • Patent applications by non-residents • Outgoing students • International environmental agreements ----------------------------------------------------------------------- • 21 variables in NGI • Hard data • Output data • Countries: 70 • Years: 1995-2005
Innovations in the NGI • 5 new variables • Introduction of geographical distances • Dimensions of globalisation generated through a statistical process (PCA)
Geographical Distances • Bilateral trade in goods data ($/GDP) weighted with geographical distance between countries (CEPII database) • Example movements in rankings: • Downward • Stagnating • Upward EU regional trade
Innovations in the NGI • 5 new variables • Introduction of geographical distances • Dimensions of globalisation generated through a statistical process (PCA)
Building of the Dimensions (PCA) (1) • Extraction of factors with maximal variance • Individual factors independent • The principal components are linear combination of original data • Variables load to different factors, following the correlation structure of the variable set ...
Building the Dimensions (PCA) • Extraction of 3 factors • After rotation, individual variables load largely to one of the 3 factors
Top 10 (1) • Year 2005 • Small countries still in the top • Exclusively european „club“ • 6 old EU countries • new EU (Malta, Cyprus) • EEA: Iceland + Switzerland
Top 10 (2) • Year 2005 • Financial positions correlate highly with the final results • All in top 15 • Developed EU • Top 20 in all 3 subindices • „newer“ and non-EU have lower rankings in trade/pol subindex • Ireland, Malta, Cyprus and Iceland not in top 20 • High positions due to financial flows and social interconnectedness
Contributions of individual dimensions differ across countries
Top 10 6 same countries in top 10 Island countries move forward - Malta, Cyprus, Iceland and UK Islands have no direct neighbours New variables show international integration (Trademarks, Patents, Environmental Agreements)
Big Developed Countries No significant changes UK upwards – politics and financial stocks Spain and Japan downwards – „restrictions“ variable, double counting Low ranking of Japan – social indicators very low
New Europe Generally lower positions than in KOF Index smaller countries corrected for country size lower scores in international financial stocks and new variables
BRIC‘s Generally better positions than in KOF Index Asian giants move strongly upwards Bigger countries corrected for country size Distant trading partners
Main issues and Possible Applications of the Index • New Globalisation Index (NGI) introduces some new perspectives to the measurement of globalisation • Important issue: globalisation vs regional integration • Geographical distances prove to be an important aspect in quantifying globalisation • Intra-EU relations bias the results towards the EU countries • Lack of bilateral data is a constraint for many variables • Globalisation IS a multidimensional phenomenon ------------------------------------------------------------------------ • Links to other indicators: • Development, economic growth, inequality?