Download
1 / 1
10 likes | 272 Vues
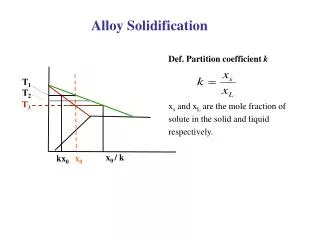
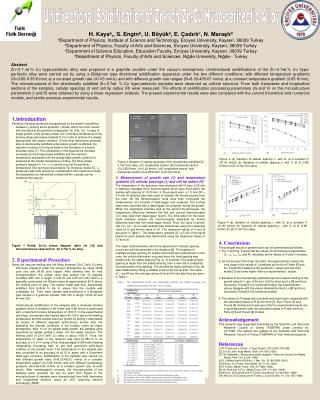
G: 3.85 K/mm V: 41.43 µm/s. Liquid phase. Solid phase. l m. Solid phase. l M. 100 µm. 100 µm. (a 1 ). (a 2 ). G: 9.95 K/mm V: 41.43 µm/s. 100 µm. 100 µm. (a 3 ). (a 4 ). (K). 823. L. 773. L+ e. 723. 1.7. 698. 692.66. e. C p. 673. . +e. 623. 0. 5. 10.

E N D
G: 3.85 K/mm V: 41.43 µm/s Liquid phase Solid phase lm Solid phase lM 100 µm 100 µm (a1) (a2) G: 9.95 K/mm V: 41.43 µm/s 100 µm 100 µm (a3) (a4) (K) 823 L 773 L+ e 723 1.7 698 692.66 e Cp 673 +e 623 0 5 10 15 Cu Zn Weight percent Copper L+ L+ Unidirectional Solidification of Zn-rich Zn-Cu Hypo-peritectic Alloy • Abstract • Zn–0.7 wt.% Cu hypo-peritectic alloy was prepared in a graphite crucible under the vacuum atmosphere. Unidirectional solidifications of the Zn–0.7wt.% Cu hypo-peritectic alloy were carried out by using a Bridgman type directional solidification apparatus under the two different conditions; with different temperature gradients (G=3.85-9.95 K/mm) at a constant growth rate (41.63 mm/s) and with different growth rate ranges (G=8.33-435.67 mm/s) at a constant temperature gradient (3.85 K/mm). The microstructures of the directionally solidified Zn–0.7wt. % Cu hypo-peritectic samples were observed as cellular structure. From both transverse and longitudinal sections of the samples, cellular spacings (l) and cell tip radius (R) were measured. The effects of solidification processing parameters (G and V) on the microstructure parameters (l and R) were obtained by using a linear regression analysis. The present experimental results were also compared with the current theoretical and numerical models, and similar previous experimental results. H. Kayaa,, S. Enginb, U. Böyüka, E. Çadırlıc, N. MaraşlıdaDepartment of Physics, Institute of Science and Technology, Erciyes University, Kayseri, 38039 TurkeybDepartment of Physics, Faculty of Arts and Sciences, Erciyes University, Kayseri, 38039 TurkeycDepartment of Science Education, Education Faculty, Erciyes University, Kayseri, 38039 TurkeydDepartment of Physics, Faculty of Arts and Sciences, Niğde University, Niğde - Turkey 1.Introduction Peritectic microstructures are characterized by the growth competition between primary and a peritectic phase, which can both coexist with the liquid at the peritectic temperature Tp. (Fig. 1a). In case of single growth of the primary phase (Co1) interface temperature of the primary phase decreases towards TLh in order to achieve the steady state growth with planar interface.On the other hand when peritectic alloy is directionally solidified under planar growth conditions, the rejection of solute in the liquid leads to the formation of a solute boundary layer [1]. The composition in the liquid at the interface increases as the single-phase solidifies and the interface temperature decreases until the steady-state growth condition is achieved at the solidus temperature of alloy. The three phase peritectic reaction (L + e ) cannot occur at the peritectic temperature (Tp) but must occurs below Tp. However, below Tp, phase can also form directly by crystallization from liquid and unless the temperature is maintained constant all the phase can be produced this way [2]. Figure 1 Partial Zn-Cu phase diagram (after ref. [3]) and microstructures observed for Zn-0.7wt % Cu alloy. 2. Experimental Procedure Using the vacuum melting and hot filling furnaces, Zn-0.7wt% Cu alloy has been prepared under the vacuum atmosphere by using 99.99 pure zinc and 99.99 pure copper. After allowing time for melt homogenization, the molten alloy was poured into 10 graphite crucibles (250 mm in length, 4 mm ID and 6.35 mm OD) held in a specially constructed hot filling furnace at approximately 50 K above the melting point of alloy. The molten metal was then directionally solidified from bottom to top to ensure that the crucible was completely full. Then, each sample was positioned in a Bridgman type furnace in a graphite cylinder (300 mm in length 10mm ID and 40 mm OD). Unidirectional solidification of the samples with a moderate thermal gradient which is between 2.69 K/mm and 8.89 K/mm is performed with a maximum furnace temperature of 1300 K. In the experimental technique, the sample was heated about 50-100 K above the melting temperature and the sample was then growth by pulling it downwards by means of different speeded synchronous motors after the stabilizing the thermal conditions in the furnace under an argon atmosphere. After 10-12 cm steady state growth, the samples were quenched by rapidly pulling it down into the water reservoir. The melting point of Zn-0.7wt% Cu alloy is about 1000 K. Thus, the temperature of water in the reservoir was kept at 283 K to an accuracy of ± 0.01 K using a Poly Science digital 9102 model heating refrigerating circulating bath to get well quenched solid-liquid interface in the present work. The temperature on the sample was also controlled to an accuracy of ±0.01 K agree with a Eurotherm 2604 type controller. Solidification of the samples was carried out with different growth rates (V=8.33-435.67 mm/s) at a constant temperature graient (G=3.85 K/mm) and with different temperature gradients (G=3.85-9.95 K/mm) at a constant growth rate (V=6.80 mm/s). After metallographic process, the microstructures of the samples were revealed. As can be seen from Figure 2, the microstructures of samples were characterized from both transverse and longitudinal sections using an LEO scanning electron microscopy (SEM). 4. Conclusions The principal results in present work can be summarized as follows. 1. Fig. 3 and Fig. 5 show that the values of microstructure parameters (lT, lL, lm, lM, and R) decrease as the values of G and V increase. 2. As can be seen from Figs. 6a and b, the experimental l values are very close to the values of l predicted by the Kurz-Fisher [5] and the Trivedi [6] models but the predicted l values with the Hunt model [7] are some higher than our experimental l values. 3. Because of the theoretically predicted exponent values relating to the growth rates for l are -0.59 and -0.50 by Hunt and Lu [8] and Kurz-Giovanola-Trivedi [9,10] numerical models, the experimental l values disagree with the values obtained by Hunt-Lu [8] and Kurz-Giovanola-Trivedi [9,10] numerical models. 4. The values of R measured in present work have been compared with the calculated values of R by the Hunt [7], Kurz-Fisher [5] and Trivedi [6] models and it was seen that the experimental results are in good agreement with the calculated values of R with the Kurz-Fisher [5] and Trivedi [6] models. Acknowledgement This research was supported financially by the Scientific and Technical Research Council of Turkey (TUBİTAK) under contract no. 107T095. The authors are grateful to the Scientific and Technical Research Council of Turkey (TUBİTAK) for their financial supports. References [1] R.Trivedi and J.S.Park, J.Cryst.Growth, 235 (2002) 572-588 [2] D.H.St John, Acta Metall.38(4), 631-636 (1990). [3] T.B. Massalski, “Binary alloy phase diagram,” American Society for Metals, Metals Park, OH, p 235 (1986) [4] D.J.Walker and A.M.Mullis, J. Mat. Sci.36, 865-869 (2001). [5] W.Kurz, D.J.Fisher, Acta Metall. 29, 11-20 (1981). [6] R.Trivedi, Metall. Trans. 15A, 977-982 (1984). [8] J.D.Hunt and S.Z.Lu, Metall.Trans. 27A, 611-623 (1996). [9] W.Kurz, B.Givanola and R.Trivedi, Acta Metall. 34, 823-830 (1986). [10] W.Kurz, B.Givanola and R.Trivedi, J.Cryst.Growth, 91, 123-125 (1988). 3. Measurement of growth rate (V) and temperature gradient (G) cellular spacings (l) and cell tip radius (R) The temperature in the specimen was measured with K-type 0.25 mm in diameter insulated three thermocouples which were fixed within the sample with spacing of 10-20 mm. In the present work, a 1.2 mm OD × 0.8 mm ID alumina tube was used to insulate the thermocouples from the melt. All thethermocouple’s ends were then connected the measurement unit consists of data-logger and computer. The cooling rates were recorded with a data-logger via computer during the growth. When the solid/liquid interface was at the second thermocouple, the temperature difference between the first and second thermocouples (T) was read from data-logger record. The time taken for the solid-liquid interface phases the thermocouples separated by known distances was read from data-logger record. Thus, the value of growth rate (V= X / t) for each sample was determined using the measured value of t and known value of X. The measured values of V and G are given in Table 1. The temperature gradient (G =T/X) in the liquid phase for each sample was determined using the measured values of T and X. The major mechanisms by which the adjustment in cellular spacing occurs are well-documented in the literature [4]. The regimes of unstable primary spacing for cellular structures were determined. In this case, the cellular elimination occurred when the local spacing was smaller than the stable spacing (Fig. 2). In contrast, if the local primary spacing is larger than the stable spacing, then a new cell is created by the mechanism of tip-splitting. The dendrite tip radius defined in Fig. 2d, was measured by fitting a suitable circle to the cell tip side. The value of l and R are the average values of lar and ltr and also they are given in Table 1. Figure 3 (a) Variation of cellular spacing l, with G, at a constant V (41.63 mm/s) (b) Variation of cellular spacing l, with V, at G (3.85 K/mm) for Zn-0.7wt %Cu alloy. Figure 2 Variation of cellular spacings of the directionally solidified Zn-0.7wt %Cu alloy, (a1) longitudinal section (a2) transverse section (G=3.85 K/mm, V=41.63 mm/s), (a3) longitudinal section (a4) transverse section (G=9.95 K/mm, V=41.63 mm/s) Figure 4 (a) Variation of cellular spacing l, with G, at a constant V (41.63 mm/s) (b) Variation of cellular spacing l, with V, at G (3.85 K/mm) for Zn-0.7wt %Cu alloy. (a)