Download
1 / 22
220 likes | 307 Vues
This study evaluates the economic effects of a 20% Advanced Energy Portfolio Standard in Pennsylvania, identifying cost-effective resource mixes and potential benefits or costs. Assessment includes wind, biomass, energy conservation, and waste coal combustion. The results show reduced electricity costs and increased employment opportunities.

E N D
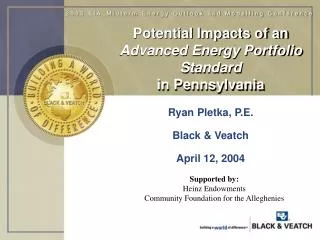
2 0 0 5 E I A M i d t e r m E n e r g y O u t l o o k a n d M o d e l l i n g C o n f e r e n c e Potential Impacts of anAdvanced Energy Portfolio Standardin Pennsylvania Ryan Pletka, P.E. Black & Veatch April 12, 2004 • Supported by: • Heinz Endowments • Community Foundation for the Alleghenies
Study Objective Assess the Potential Economic Impacts of a 20 Percent Advanced Energy Portfolio Standard (AEPS) in Pennsylvania • Identify most cost effective mix of resources built in response to AEPS • Identify economic benefits or costs - 2
General AEPS Assumptions • Timeframe • 2006 – 6% • Increases 2%/year • 2014 – 20% • Evenly split in two-tiers: • Tier I – RE & EE • Tier II – waste coal, greenhouse gas, advanced technologies • No imports or exports (simplification for analysis) • Production Tax Credit through 2009 2004 Tier II Baseline 2004 Tier I Baseline - 3
AEPS Resource Assessment Methodology • Screen Technologies • Characterize Resources • Estimate Cost to Generate and Transmit Electricity • Apply Avoided Cost of Power Model • Develop Supply Curves • Develop Least-Cost Portfolio of Projects - 4
Tier I Wind Low-impact hydro Biogas and coal mine methane Biomass Solar photovoltaics “Energy conservation” – demand side, ie, consumers “Energy efficiency” – supply side, ie, power plants Solar thermal Ocean and lake energy Solid waste (non combustion) Fuel cells fueled by Tier I resources Tier II Resources Waste Coal New facilities Air pollution controls at existing facilities Integrated gasification combined cycle Fuel cells fueled by non-Tier I resources Greenhouse gas (GHG) reductions AEPS Eligible Resources - 5
Wind Assessment • Pennsylvania wind resources relatively modest • GIS analysis based on latest NREL data • Capital Cost: • Base: $1,175-$1,275/kW • Transmission: +$20-$110/kW • “Expensive” resources: +$500/kW (50% of total) • Included 300 MW, class 5, offshore wind farm in Lake Erie - 6
Biomass Cofiring Assessment • Pennsylvania has good biomass resources and lots of coal plants • Focused on cofiring at 38 existing coal units • Capital cost: $100-$700/kW • Biomass resources • Only sustainable and clean resources identified • Assessment based on ORNL database • Biomass collected from 75 mile radius around plants - 7
Energy Conservation / Efficiency Assessment • Good opportunity for energy conservation/efficiency in PA • Analysis Based on B&V, ACEEE assessments • Residential measures • Commercial & Industrial measures • Over 16,000 GWh of potential identified over 20 years • About 10% of PA consumption • Wide range of costs and payback potential • Consumers won’t necessarily implement measures even if economical - 8
Waste Coal Combustion • Excellent waste coal resource in Pennsylvania • To be eligible for AEPS, waste coal projects must be low emissions • Analysis Based on PA DEP waste coal assessments • 3 Planned New Site Developments • 15 Environmental control upgrades at existing plants • Environmental control upgrade projects also receive substantial revenue from emissions credit markets - 9
Properly Characterizing Resource Cost • One of the largest modeling differences between renewables and fossil fuels is that costs vary tremendously based on renewable resource quality • There are a limited number of very good renewable / advanced project sites • Costs rise as “low-hanging” projects are developed • Supply curves capture these effects - 10
~70 MW ~30 MW ~60 MW Biogas Supply Curve 2006Premium over Avoided Costs - 11
Aggregate Tier I Supply Curve 2010 Tier I 2010 requirement Premium Biomass Cofiring and Energy Efficiency / Conservation add Significant Flexibility - 12
Aggregate Tier II Supply Curve 2010 Tier II Premium 2010 requirement - 13
Optimum Mix of Resources to Meet the AEPS Requirements Tier II Energy Mix Tier I Energy Mix - 16
Tier I Least Cost Mix • Wind, biomass cofiring, and energy conservation comprise about 80 percent of mix • Some solar (4 MW) assumed to be built, even though not economical - 17
Economic Impacts Assessment • Compared building a 20% AEPS portfolio to building the “Business As Usual” (BAU) portfolio • Cost of electricity • Economic impacts (Jobs, Output, Earnings) • Fossil fuel prices • BAU Portfolio: 50% coal, 40% combined cycle, 10% simple cycle • Portfolios equated on an equivalent energy production basis • RPS portfolio: 6,470 MW • BAU portfolio: 2,460 MW • Environmental externalities purposely not assessed - 18
Cumulative Economic Impacts • Economic Benefits of the AEPS Portfolio compared to Business as Usual • Cost of electricity: reduced by $2.7 billion (cumulative present value), about 1% when spread over all consumption • Employment: Creates over 70,000 additional job-years over 20 years (average of new 3,500 jobs) • State output: Creates about $7 billion in increased state output • Personal Income: Creates about $2.5 billion in additional earnings - 19
Pennsylvania Employment Impacts, “Job-years” per MW Impacts proportional to the percent of project expenditures made in PA in various industries RPS portfolio: 6,470 MW BAU portfolio: 2,460 MW - 20
AEPS Enacted into Law in Late 2004 • Our model does not match what was finally signed into law • Solar PV Standard - 0.5% of electricity demand in 15 years (~680 MW) • Implementation Challenges • Ensuring new projects are deployed to meet the requirements of Tier I • Geographic Scope • Definition of Low-Impact Hydro • Long-Term Contracts • Encouraging demand-side management • Tier II over-subscription • Developing rules - 21
Conclusions and Acknowledgements • Acknowledgements • Community Foundation for the Alleghenies – Mike Kane • Heinz Endowments • PA DEP • REPP • Industry • Contact Ryan Pletka Black & Veatch 913-458-8222 pletkarj@bv.com - 22