Download
1 / 29
290 likes | 380 Vues
Join the live game show in College Station where students compete using Stata software to test their statistics knowledge. Answer questions, earn points, and use lifelines to climb the leaderboard!

E N D
Who Wants to be a Statistician? Live from College Station!
Using StataQuest, students will be selected randomly to participate An ordering question will be asked of the first student on the list If the student gets it right, he/she comes to the “hot seat” If the student does not get it right, it goes to the next student This continues until someone gets to the hot seat You may earn up to three points at the hot seat Game Rules
Correct answer +1 pts Incorrect - back to 0, Question goes to next on list for a chance for the point You may use one of three “lifelines” - phone (or ask) a friend, ask the class, or 50/50 If you are satisfied with your points, you may stop So, let’s get started Game rules
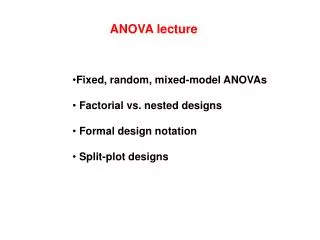
A. F distribution B. Chi-square curve C. Normal curve D. Student’s t Correct Order: Normal Chi-Square t F Put the following topics in order, as they were presented in class
Which of the following is a measure of spread? A. Standard Deviation B. Mean C. Median D. Proportion 50-50: A or C A is correct!
Which of the following is a robust measure of center? A. Mean B. Standard Deviation C. Median D. SIQR 50-50: Median, SIQR Correct Answer: C
Which of the following graphs is best suited for side by side comparisons? A. Stem and Leaf B. Box Plot C. Histogram D. Normal Quantile 50-50 B,D B is correct!
A. One Sample t B. Rank-Sum C. Two Sample t D. ANOVA Correct Ordering One Sample t Two Sample t Rank Sum ANOVA Place the following in the order they were presented in class
Under which of the following conditions is the sample mean NOT normally distributed? A. Large sample from a normal population B. Small sample from a normal population C. Large sample from a non-normal pop D. Small sample from a non-normal pop 50-50: C or D The correct answer is D!
Based on the box-plots below, which SAMPLE has the highest median? • A. • B. • C. • D. • E. Can’t tell from info given. • 50-50: A or E • A is correct! A C B D
Which of the following terms describe the data set graphed below? A. Left skewed B. Right skewed C. Normal D. Symmetric - heavy tails E. Symmetric - light tails 50 - 50: A or B B is correct!
A. Two-Way ANOVA B. Blocked ANOVA C. Two sample t D. One-Way ANOVA Correct order is: Two way ANOVA (4) Blocked ANOVA (3) One way ANOVA (2) Two sample t (0) Put the following procedures in order: the one that requires the most sums of squares first
Which of the following should be used to compare weekly study hours between freshmen & sophomores? A. One Sample t B. Paired t C. Two Sample t D. Rank-Sum E. C or D - it depends 50-50 C or E E is correct!
Which of the following should be used to compare weekly study hours of students - categorized by classification only? A. One sample t B. One way ANOVA C. Two way ANOVA D. Blocked ANOVA 50-50 B or C B is correct!
Which of the following should be used to compare weekly study hours of students - categorized by classification and major? A. Two sample t B. One way ANOVA C. Blocked ANOVA D. Two way ANOVA E. C or D - it depends 50-50: C or E E is correct!
A. Bug Traps B. Exercise & Lactic Acid C. Smoking Mommas D. Frozen Dinners Correct Order D. B. C. A. Put the following examples in the order they were presented in class:
Which procedure should be run after rejecting the null hypothesis in one-way ANOVA? A. Two Way ANOVA B. One Way ANOVA C. Two sample t D. Tukey’s procedure 50-50 C or D D is correct!
The null hypothesis is rejected when A. The p-value is less than a B. The p-value is greater than a C. The confidence interval includes the null D. The CI does not include the null E. A and D 50 - 50: B or E E is correct!
Which of the following should be tested first in two-way ANOVA? A. H0: no interaction B. H0: no A effect C. H0: no B effect D. Order doesn’t matter in two-way ANOVA E. These tests are not part of two-way ANOVA 50-50 A or E A is correct!
A. Box plots B. Normal Quantiles C. Histogram D. Stem and Leaf Correct Order Stem and Leaf Histogram Box plots Normal Quantiles Put the following graphs in the order they have been presented since Exam I:
To compare two non-normal populations with small samples, use A. One sample t B. Paired t C. Two Sample t D. Rank-Sum 50-50: B or D D is correct!
Non-normality is BEST detected with a A. Box Plot B. Stem and Leaf C. Histogram D. Normal Quantile Plot 50-50 C or D D is correct!
The paired t test is equivalent to A. Two sample t B. One sample t on differences C. Two way ANOVA D. Blocked ANOVA 50-50 B or D B is correct!
A. “Student” B. Florence Nightingale C. John W. Tukey Correct Order Nightingale “Student” Tukey Put the three great statisticians in the order they were first mentioned in class
The null hypothesis is rejected when A. The p-value is less than a B. The CI does not include the null value C. The p-value is greater than a D. The CI includes the null value E. A and B F. C and D 50-50: E or F E is correct!
Find the mean of the data represented in the stem-and-leaf below: A. 57 B. 60 C. 63 D. Not enough information 50-50: B or C B is correct! 5 | 7 6 | 03
An interaction plot A. Should have approximately parallel lines if no interaction is present B. Should have crossing lines if no interaction is present C. May have crossing lines - even if we fail to reject the null hypothesis of no interaction D. A and C 50 - 50 A or D D is correct!
Computaions Required • Mean or Median from a small data set • df for one-sample or paired t
Be sure to • Go through the notes • Examine the HW and Quiz Keys • Get HW9 Key before leaving • Understand processes, not try to memorize facts • Interpret all four graphs: stem-and-leaf, histogram, box-plot, normal quantile plot