BSAI SAFE Report November 2005
570 likes | 829 Vues
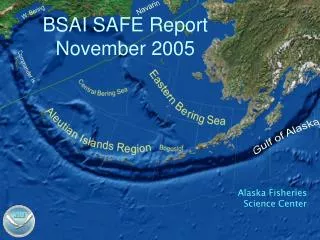
Navarin. W. Bering. BSAI SAFE Report November 2005. Commander Is. Gulf of Alaska. Alaska Fisheries Science Center. BSAI Plan Team Members (14 Members). NPFMC -- Jane DiCosimo (Plan Coordinator) NMFS (AFSC) --Loh-Lee Low (Chair) Mike Sigler (Vice Chair) Grant Thompson

BSAI SAFE Report November 2005
E N D
Presentation Transcript
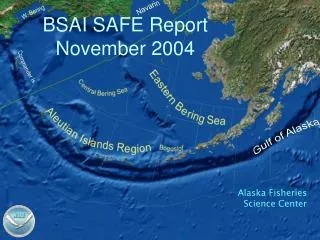
Navarin W. Bering BSAI SAFE ReportNovember 2005 Commander Is. Gulf of Alaska Alaska Fisheries Science Center
BSAI Plan Team Members (14 Members) NPFMC -- Jane DiCosimo (Plan Coordinator) NMFS (AFSC) --Loh-Lee Low (Chair) Mike Sigler (Vice Chair) Grant Thompson Lowell Fritz Kerim Aydin Dan Lew NMFS (Region) Andy Smoker USF&W -- Kathy Kuletz ADF&G -- Ivan Vining Dave Carlile Univ.Alaska-- Brenda Norcross WDF&W -- Michele Culver Halibut Comm-- Bill Clark
2005 BSAI SAFE ReportsMany Contributors from Various Agencies and Universities 34 Authors for Status of Stocks Section 116 Contributors to Ecosystems Section 9 Authors for Economics Chapter
Total U.S.Landings (2004)4.37 million mt, $3.65 Billion(From NOAA Fisheries Publication, Fisheries of the United States)
Overview of Exploitable Biomass By Major Species Groups
Nov 2005 AssessmentBSAI Exploitable BiomassYear 2006 Total = 17.215 MMT(down 9% from last year, mainly in EBS Pollock and P.Cod)
Nov 2005 AssessmentBSAI Flatfish Complex BiomassYear 2006 Total = 5.973 MMT(up 635,000 mt from last year)
Nov 2005 AssessmentBSAI Rockfish Complex BiomassYr 2006 Total = 653,400 MT(No Analysis Update from last year)
Bering Sea-Aleutians Groundfish Catch28 Year History under MS-FCMA(in thousands of mt)(from Table 1, Economics Section) 91-92
SAFE Document Big Picture • Possible new area/species splits • Now: Authors want to split SR and RE by area • Future: Authors & Team want to split “Other Species” • Future: Authors & Team want to split Pcod ABC by area • Future: Authors want to split skates, sculpins by area • Team ABCs mostly at maximum permissible • except: Greenland turbot (24%) • Team mostly agrees with authors on total ABCs • except: pollock (3 areas), cod, turbot • Rockfish now on 2-year assessment cycle • Models re-run with new catch data only
Ecosystem Considerations • 20 of 22 chapters now have EC sections • 16 have ecosystem impacts on the species and fishery impacts on the ecosystem • Often limited to qualitative considerations • Added influence of temperature on surveys • Pollock, cod, all flatfish except turbot and “other” • Added effects of regime shifts on recruitment • Cod, all flatfish except turbot and “other” • Added results from ecosystem models • Pollock, Atka mackerel, skates, squid, octopus, sculpins
Plan Team’s Estimates of OFLs and ABCs • Plan Team numbers are in Table 5 of Appendix 5 of SAFE report • Minor deviations from SSC Estimates • For Bogoslof Pollock • For Other Species (sharks and octopuses) • Changes are minor and PT defers to SSC numbers
Summary (Cod and Sablefish)(From Table 5,Team Summary Appendix A)
Summary (Atka Mackerel & Other Species)(From Table 5,Team Summary Appendix A)
EBS Pollock AssessmentNotable Features Straight-forward update of last year’s assessment. Year 2005 Surveys Bottom Trawl Biomass = 5.13 mmt, up 37% from 2004 survey. No hydroacoustic survey. 3. Year 2005 Modeling 6 scenarios of Age-Structure Model, Used Reference Model 1 Age3+ Biomass for 2005 = 9.3 mmt, still high but down from last year’s estimate of 11 mmt 4. Recruitment 2000 Year Class (5 year-old fish) is strongly Above Average and would make up about 27% of the exploitable biomass in 2006.
A-Season B-Season Fishery Catch Patterns for 2003-05 (A & B Seasons)
Aleutian Islands Region (Last survey was 2004 Survey, Biomass = 130,000 mt)
Aleutian Island RegionPollock Assessment 1. Survey Biomass (NRA Area) • 1991 137,000 • 1994 77,500 • 1997 97,500 • 2000 105,600 • 2002 175,000 • 2004 130,000 2. Has age structured Model, but not quite ready for use 3. ABC from Tier 5 = 29,400 mt
Bogoslof Pollock Stock New survey in 2005 by R/V Miller Freeman -- Biomass = 253,000mt, up 28% from 2003 New Age Structured Model developed for Management Strategy Evaluations - -High 4.5 mmt model biomass was reached due to abnormally high 1978 Yr Class. -- At normal year class conditions, biomass would be much lower. -- Model still could not incorporate stock inter-relationships and effects of fishing on the same stock outside of the Bogoslof area. 3.Thus model is not quite Ready for Use and we used Tier 5 to claculate ABC
Bogoslof Region Pollock ABCPlan Team versus SSC Procedure 1. Plan Team Method Uses Tier 5 ABC max permissible = Biomass x 0.75 M ABC = 253,000 x 0.75 x 0.3 = 38,000 mt 2. SSC Method Uses Tier 5 but reduced Fishing Rate Uses 2 mmt as Target Biomass and since 2005 Biomass was 12.6 % of Target, fishing rate should be reduced proportionately ABC was adjusted down by formula to 5,500 mt
Pacific Cod AssessmentNotable Features Brand New Model New model structure with software algorithm Several technical changes Year 2005 Surveys -- EBS Trawl Biomass = 604,000 mt, no change 3. ABC is based on Tier 3 -- 1999 year class is clearly above average; but last 4 year classes are below average, thus biomass declining slowly.
Sabalefish AssessmentNotable Features BSAI Stock Assessment is embedded in the Model for the Alaska-wide Single Stock -- This year’s assessment is a straight forward update of last year’s analyses and model with several technical changes Year 2005 Surveys -- Survey abundance Index decreased 2.5% from 2004 Model Spawning Biomass -- Projected to remain stable from 2005 to 2006. -- The 1997 and 2000 Yr classes are projected to account fro 38% of the spawning biomass in 2006. ABC is based on Tier 3 -- Apportionment of ABC to EBS and Aleutians is based on Relative Population Weight based on the surveys (a 5-Yr weighting)
Flatfish ComplexOverview of the Complex 1. Survey Biomass -- Still relatively high biomass , -- Exception is Greenland Turbot, a deep water flatfish 2. Models -- Developed for most of the species -- Models are not available for minor components 3. Biomass levels are high and expected to remain so. Exception is Greenland Turbot 4. TACs have been set substantially below maximum possible ABCs, even for Greenland Turbot
Greenland Turbot Stock Assessment, Dec 2005 Shelf survey B down 24% from 2004 - 05
Other Flatfish Group Assessment, Dec 2005 Remain Butter Rex Starry Model Biomass and Recruitment Estimations are not Available 1. Species Composition -- 16 species from EBS, 5 species from Aleutians, 95% of catch are starry flounder and rex sole 2. Biomass Estimates from Surveys only -- Rather Stable to Increasing Trend in recent years in both regions
Rockfish AssessmentsMinor Updates No Assessment Updates for 2005 -- Analyses are on 2 year cycle to coincide with Slope surveys. -- Minor updates of catch data applied to models cause small changes in some cases
Atka Mackerel AssessmentNotable Features, Chapter 15 Straight update of last year’s assessment Survey Biomass 2004 = 886,800 mt; up 15% from 2002 Recruitment of 2 recent year classes (2002-2003) were below average ABC is apportioned by 3 Aleutian Areas; Eastern (19.8%), Central (42.6%), and Western (37.6%) Extensive analyses of Ecosystem Interactions where major predation are from P. cod (25%), fishing (21%) and Steller sea lions (16%)