Foothill College
Foothill College. Enrollment and Success Rate Segmentations. Rob Johnstone, 8/4/03. Section 1 Foothill Fall 2002 Headcount Segmentation. 1.1 Foothill Headcount Segmentation. Starting 2002F Credit Students Headcount = 18,896

Foothill College
E N D
Presentation Transcript
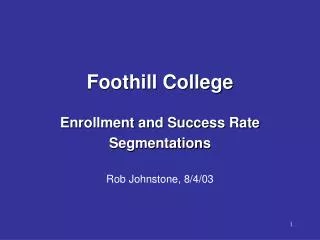
Foothill College Enrollment and Success Rate Segmentations Rob Johnstone, 8/4/03
1.1 Foothill Headcount Segmentation • Starting 2002F Credit Students Headcount = 18,896 • Note: Total Undup Headcount = 19,524 – 628 students took Non-Credit courses only • Segment 1: PE and Fine Arts Courses Only • N = 4,736, or 25% of overall • Fine Arts Only = 14% of overall • PE Only = 11% of overall • Remaining Headcount = 14,160 (75% of overall) - took courses not exclusively in PE and Fine Arts • Segment 2: Students Taking Single Course, not PE or FA • N = 5,884, or 31% of overall • See 2.6 for chart giving divisions of single course takers • Remaining Headcount = 8,276 (44% of overall) – taking multiple courses, not just in PE and Fine Arts
1.2 Foothill Headcount Segmentation • Segment 3: Multiple Course Takers, Not PE or FA Only, AA & Above and Special Admit • N = 2,406, or 13% of overall • BA/BS+ = 8% of overall • AA/AS = 2% of overall • Special Admit = 1% of overall • Unrecorded Educ Status = 1% of overall • Remaining Headcount = 5,870 (31% of overall), HS/HS Equivalent students taking multiple courses not exclusively in Fine Arts/PE
1.3 Foothill Headcount Segmentation • Segment 4: Multiple Course Takers, Not PE or FA Only, HS/HS Equivalent, Taking 1+ Pre-Collegiate Courses • Pre-Collegiate Courses defined as: • English 100,110,108,205,215 • ESL 130s,140s,150s,160s,025 • Math 250-200-101-105 • N = 1,397, or 7% of overall • PC English Only = 218, or 1% of overall • PC ESL Only = 504, or 3% of overall • PC Math Only = 329, or 2% of overall • Multiple PC Courses = 326, or 2% of overall • Remaining Headcount = 4,473 (24% of overall), HS/HS Equivalent students taking multiple courses not exclusively in Fine Arts/PE and no Pre-Collegiate courses
1.4 Foothill Headcount Segmentation • Segment 5: SAM Code/Occupational Status Breakdown of HS/HS Equivalent Students taking Multiple Courses not solely in PE and/or FA, and not in Basic Skills • SAM Codes are a state definition for the occupational/vocational level of a given course: • A = Apprenticeship (APRT 125, APRT 123) • B = Advanced Occupational (ACTG 001C, CAST 052B) • C = Clearly Occupational (BUSI 022, CIS 052b2) • D = Possibly Occupational (PHOT 001, MUS 010) • E = Non-Occupational (ENG 1A, MUS 8, MATH 105) • N=4,473 HS/HS Equiv students taking multiple courses (non BS): • Highest SAM Code was A: 543 (3% of overall) • Highest SAM Code was B: 80 (<1% of overall) • Highest SAM Code was C: 1,296 (7% of overall) • Highest SAM Code was D: 325 (2% of overall) • Highest SAM Code was E: 2,229 (12% of overall)
1.5 Foothill Headcount Segmentation Summary • Starting 2002F Credit Students Headcount = 18,896 • Segment 1: PE and Fine Arts Courses Only • N = 4,736, or 25% of overall • Segment 2: Students Taking Single Course, not PE or FA • N = 5,884, or 31% of overall • Segment 3: Multiple Course Takers, Not PE or FA Only, AA & Above and Special Admit • N = 2,406, or 13% of overall • Segment 4: Multiple Course Takers, Not PE or FA Only, HS/HS Equivalent, Taking 1+ Basic Skills Courses • N = 1,397, or 7% of overall • Segment 5: Multiple Course Takers, Not PE or FA Only, HS/HS Equivalent, Not Taking Any B.Skills Courses • N = 4,473, or 24% of overall
1.6 –Divisions of 2002F Single Course Takers, not in Fine Arts or PE Data Excerpted from Executive Summary P13
2.1 Foothill Success Rate, 2002S-2003W • Overall Success Rate = 84% • Based on 123,615 course enrollments. • Success is defined as a grade of A, B, C, or P. • Withdrawals are included as non-successes.
2.2 Foothill Success Rate, 2002S-2003W • Step 1 – Analyze and remove Human Performance and Performing Arts enrollments • PA Rate – 100% • HP Rate– 93% • All Others Rate – 81% (N=100,815)
2.3 Foothill Success Rate, 2002S-2003W • Step 2 – Analyze and remove AA/AS, BA/BS+, and Special Admit • BA/BS+ Rate – 87% • AA/AS Rate – 86% • Special Admit Rate – 81% • HS/HS Equiv Rate – 79% (N=63,298)
2.4 Foothill Success Rate, 2002S-2003W • Step 3 – Analyze and remove Basic Skills courses • Basic Skills Course Rate – 75% • All Others Rate – 79% (N=57,261)
2.5 Foothill Success Rate, 2002S-2003W • Step 4 – Analyze and remove by SAM Code • SAM Code A (Apprenticeship) Rate – 95% • SAM Code B (Advanced Occupational) Rate – 83% • SAM Code C (Clearly Occupational) Rate – 81% • SAM Code D (Possibly Occupational) Rate – 79% • SAM Code E (Not Occupational) Rate – 78% (N=40,857)
2.6 Foothill Success Rate, 2002S-2003W • Step 5 – Analyze and remove Non-transferable and CSU-Only transferable courses • Non-Transferable Rate – 84% • CSU Only Rate- 89% • UC-Transferable Rate – 75% (N=30,734)
2.7 Foothill Success Rate, 2002S-2003W • Step 6 – Analyze UC Transferable courses, non-occupational, non-basic skills, non HP/PA, taken by HS/HS equiv students, BY district and/citizenship. • Non US Citizens – 80% • N=9,415 • US Citizens, Non-FHDA District of Residence – 73% • N=3,403 • US Citizens, FHDA District of Residence – 73% • N=17,745