Material Testing
Material Testing. Material Testing. Reproducible evaluation of material properties . Static Testing. Material response to constant loading. Dynamic Testing. Material response to varying loading conditions, including magnitude, cycling, and mode. Static Material Testing.


Material Testing
E N D
Presentation Transcript
Material Testing Reproducible evaluation of material properties Static Testing Material response to constant loading Dynamic Testing Material response to varying loading conditions, including magnitude, cycling, and mode
Static Material Testing Evaluation of Material StrengthDeformationFractureDesign requirement compliance Standardized Tests Tensile testCompression testHardness test
Tensile Test Uniaxial A straight line axial force is applied to a test sample(typically in the y axis) Hounsfield Tensometer Image courtesy of NSW Department of Education and Training Destructive Force is applied until sample fails
Tensile Test Standard Test Sample (dog bone) • Ensures meaningful and reproducible results • Uniform cross section
Tensile Test Procedure Dog bone is created to test specifications Dog bone is secured in tester
Tensile Test Procedure A tension force (F) is applied to the dog bone until failure occurs Simultaneously the applied tension force (F) and dog bone elongation (d)are recorded F d A plot is created from the stored load elongation data
Tensile Test Data F d A B Test sample A and B are 230 red brass. Test sample A has a diameter of 0.125 in. Test sample B has a diameter of 0.375 in. If both samples are tested to failure, will the applied tension force and elongation be the same for both tests? NO – Why?
Tensile Test Data Load-elongation results are dependent upon sample size Larger sample indicates larger load-elongation How can test data be manipulated to represent a material and not an individual test sample?
Tensile Test Data To eliminate test results based on sample size, calculate sample stress Stress is load per unit area Divide load (F) by the original test sample cross-sectional area (A0)
Tensile Test Data Calculate the stress in the dog bone with a 430 lb applied force.
Tensile Test Data Manipulating Elongation Results To eliminate test results based on sample size, calculate sample strain • Strain (e) - the amount of stretch per unit length • Elongation (d) under load divided by the original Length (L0)
Tensile Test Data Calculate the strain in the dog bone with an elongation of 0.0625in.
Tensile Test – Stress-Strain Curve Initial response is linear Stress and strain are proportional to one another Elastic Range Proportional Limit (The stress at which proportionality ceases)
Tensile Test – Stress-Strain Curve Modulus of Elasticity (E)The proportional constant (ratio of stress and strain) A measure of stiffness – The ability of a material to resist stretching when loaded An inherent property of a given material
Tensile Test – Stress-Strain Curve If the load is removed, the test sample will return to its original length The response is elastic or recoverable Exaggerated stretch to illustrate principle
Tensile Test – Stress-Strain Curve Elastic LimitUppermost stress of elastic behavior Elastic and proportional limit are almost identical, with the elastic limit being slightly higher
Tensile Test – Stress-Strain Curve ResilienceThe amount of energy per unit volume that a material can absorb while in the elastic range Area under the stress-strain curve Why would this be important to designers? Hint: car bumper
Tensile Test – Stress-Strain Curve Yield PointWhen the elastic limit is exceeded A very small increase in stress produces a much greater strain Most materials do not have a well-defined yield point
Tensile Test – Stress-Strain Curve Offset Yield Strength • Defines the stress required to produce a tolerable amount of permanent strain • Common value is 0.2%
Tensile Test – Stress-Strain Curve Plastic DeformationUnrecoverable elongation beyond the elastic limit When the load is removed, only the elastic deformation will be recovered
Tensile Test – Strength Properties • Stress Strain Curve Plastic deformation represents failure Part dimensions will now be outside of allowable tolerances
Tensile Test – Stress-Strain Curve Deformation • Test sample elongation • Cross-sectional area decreases • Load bearing ability increases – Why? • The material is getting stronger – How?
Tensile Test – Stress-Strain Curve • Weakest point is stretched and becomes stronger • New weakest point is stretched and becomes stronger, and so on • This keeps occurring until the decrease in area overcomes the increase in strength
Tensile Test – Stress-Strain Curve • Tensile StrengthLoad bearing ability peaks • Force required to continue straining the test sample decreases • Weakest location at the peak continues to decrease in area – Necking
Tensile Test – Stress-Strain Curve FailureIf continued force is applied, necking will continue until fracture occurs DuctilityAmount of plasticity before fracture The greater the ductility, the more a material can be deformed
Tensile Test – Samples Compare the material properties of these three metal samples
Tensile Test – Stress-Strain Curve • Brittleness • Material failure with little or no ductility • Lack of ductility, not lack of strength
Tensile Test – Stress-Strain Curve • Toughness • Work per unit volume required to fracture a material • Total area under the stress-strain curve from test initiation to fracture (both strength and ductility)
Compression Test • Stress and strain relationships are similar to tension tests – elastic and plastic behavior • Test samples must have large cross-sectional area to resist bending and buckling • Material strengthens by stretching laterally and increasing its cross-sectional area
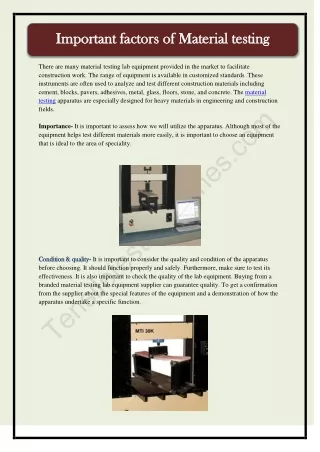
Hardness Testing • Resistance to permanent deformation • Resistance to scratching, wear, cutting or drilling, and elastic rebound • Brinell Hardness TestA tungsten carbide ball is held with a 500lb force for 15 sec into the material • The resulting crater is measured and compared
Hardness Testing • Rockwell TestA small diamond-tipped cone is forced into the test sample by a predetermined load • Depth of penetration is measured and compared
Image Resources NSW Department of Education and Training (2011). Retrieved from http://lrrpublic.cli.det.nsw.edu.au/lrrSecure/Sites/Web/tensile_testing/index.htm?Signature=%287e02281c-318a-461b-a8ed-3394db0c4fe6%29