Download
1 / 19
190 likes | 750 Vues
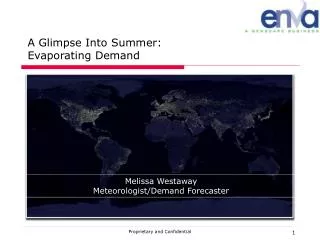
A Glimpse Into Summer: Evaporating Demand Melissa Westaway Meteorologist/Demand Forecaster Agenda Enva – What We Do Demand Forecasting Key Factors That Affect Demand Demand Destruction Increasing Compare The Data Summer Outlook Conclusion Enva Service Portfolio

E N D
A Glimpse Into Summer: Evaporating Demand Melissa Westaway Meteorologist/Demand Forecaster Proprietary and Confidential
Agenda • Enva – What We Do • Demand Forecasting • Key Factors That Affect Demand • Demand Destruction Increasing • Compare The Data • Summer Outlook • Conclusion Proprietary and Confidential
Enva Service Portfolio • 3 Reports Delivered Daily • Recap Report • Bal-Day/Next-Day Report • Bal-Week/Next-Week Report • Live Interaction • Daily briefing calls • Access to Enva Operations Center • Analysts can re-run model with client input MISO • Daily Market Intel • Bal-Week/Next-Week PJM • Daily Market Intel • Bal-Week/Next-Week NYISO Daily Market Intel CAISO Daily Market Intel • NEPOOL • Daily Market Intel Proprietary and Confidential
Base Case Modeling & Analysis Generator Availability Power Flows & Limits Generator 10-Part Bids & Constraints ISO Operational & RTMP Rules Hourly Forecast Demand (by zone) Expert Review Hourly Forecast Imports (by zone) Expected Power Flows & Hourly Base Case LMP’s Proprietary and Confidential
Demand Forecasting Process • Inputs • ISO Actual Demand • Weather Data • (for 200+ locations) • Weatherbug • WSI • Public data & models • Demand Analysis • By meteorologist • Reviews and modifies forecast based on weather events, recap and R/T developments • NeuroBuilder™ • Industry’s most advanced Neural Net • Hourly demand values out 15 days Result: Industry’s most comprehensive and accurate demand forecast Proprietary and Confidential
Short Term Effects On Demand • Assess factors that impact demand based on day and season: • Weather (e.g., temperature, humidity, precipitation) • Human habits (e.g., school is in/out of session, Fridays, holidays) • Unusual events (e.g., hurricane, Superbowl, blackouts) Proprietary and Confidential
The Green Effect • The trend of demand destruction based on increases in: • Energy efficiency & conservation • Behind the meter generation • Economic pressures Proprietary and Confidential
Energy Efficiency & Conservation • Energy conservation means using less energy and avoiding wasteful uses. • This is accomplished by: • Using energy efficient products/appliances • Modifying usage habits (e.g. reducing AC use) Proprietary and Confidential
Energy Efficiency Resource Standards (EERS) • An EERS – Energy Efficiency Resource (or portfolio) Standard – aims to reduce or flatten electric load growth through energy efficiency (EE) measures. Goals may specify reductions in energy (MWh), demand (MW), or both. Many specify both overall energy reductions and peak-load reductions. • 18 states have passed EERS legislation • 3 states have pending EERS legislation • 14 states passed significant Energy Efficiency legislation in 2008 Source: FERC http://www.ferc.gov/market-oversight/mkt-electric/overview/elec-ovr-eeps.pdf Proprietary and Confidential
Behind the Meter Generation • Example – California Solar Initiative Goal: 3,000 MW of new solar-produced electricity by 2016 Proprietary and Confidential
Economic Impact On Demand • Episodes of sharply declining demand coincide with periods of economic recession. • This corresponds to episodes of increased unemployment. TeraWatts Gogerty, Nick. "The Green Re-cession: Via Demand Shock." SeekingAlpha.com. 27 Mar. 2009. 27 Mar. 2009 <www.seekingalpha.com>. Proprietary and Confidential
1975 2009 1992 source www.miseryindex.us Proprietary and Confidential
EIA Demand Trends • Between 2002 to 2006, the average US annual electricity demand grew by an average of 1.6% per year. • Last year EIA’s outlook for 2008 to 2030, electricity demand growth will average only 1.2% per year. • In January 2009, EIA revised demand forecast: • Drop of 0.8% in 2009 • Rise of 1.5% in 2010 source US EIA Proprietary and Confidential
Enva Summer 2009 Outlook • Summer demand is represented by an average of the months June, July and August. • Assuming the summer of 2009 to have similar weather to summer of 2008. Proprietary and Confidential
Demand Percent Change 2006-2007 -1.9% 2007-2008 -1.2% 2008-2009 (EIA) -0.8% 2008-2009 (Enva) -1.2% Proprietary and Confidential
Demand Percent Change 2006-2007 +1.7% 2007-2008 -5.1% 2008-2009 (EIA) -0.8% 2008-2009 (Enva) -4.1% Proprietary and Confidential
Demand Percent Change 2006-2007 +2.1% 2007-2008 -3.7% 2008-2009 (EIA) -0.8% 2008-2009 (Enva) -2.8% Proprietary and Confidential
SUMMARY • We expect the continuation of demand destruction. • The percent change will vary by region from roughly -1% to as much as -4%. • Demand summer outlook is an average of the season. • Volatile days will still occur. Proprietary and Confidential
Closing • Questions? • Thank you for attending today’s presentation Enva, Inc. 177 Huntington Ave., Suite 2100 Boston, Massachusetts, 02115 Tel. (617) 790-0900 Fax. (617) 790-0932 www.envapower.com Proprietary and Confidential