Growing Cooler The Evidence on Urban Development and Climate Change
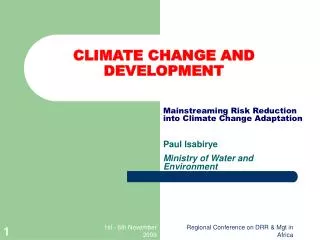
Growing Cooler The Evidence on Urban Development and Climate Change. The three-legged stool. V ehicle M iles T ravelled. Fuel carbon content. MPG. We need progress on all 3 legs, but climate policy discussions have mostly ignored VMT. VMT growing faster than population.

Growing Cooler The Evidence on Urban Development and Climate Change
E N D
Presentation Transcript
Growing CoolerThe Evidence on Urban Development and Climate Change
The three-legged stool Vehicle Miles Travelled Fuelcarboncontent MPG We need progress on all 3 legs, but climate policy discussions have mostly ignored VMT
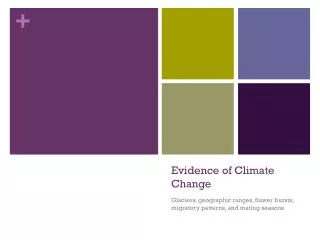
VMT growing faster than population Growth of VMT, vehicle registrations, and population in the United States relative to 1980 values
Why do we drive so much? …Does it look like we have any other choice?
If Trends Continue … The total amount of miles we drive will grow 59 percent From 2005-2030 Source: U.S. Dept. of Energy
Bottom line of the research Compact, walkable neighborhoods cut VMT by an average of 30 percent (With higher ranges possible)
Compact Development Reduces Driving Driving vs. Residential Density 35000 30000 25000 I’On, Mount Pleasant SC SF Miles Driven per Household 20000 - - - - LA --single-family --- - - Chicago 15000 --townhouses -- mid-rise condos 10000 --high-rises 5000 0 50 100 150 200 Households/Acre
People in walkable neighborhoods drive less People who live in neighborhoods with the lowestwalkability drive: • 39 miles more per person each weekday • 30% more than those with the highest walk- ability. On weekends, those in most walkable drive 40% less SMARTRAQ report, 2007
Projected 2030 Savings from Compact Development • Shifting 60% of new growth to compact patterns • 85 million metric tons of CO2 in 2030 • Would be equal to a 28% increase in CAFE standards to 32 mpg in 2020 (but benefits extend well beyond) • Fuel cost savings in 2030: $24 billion • Cumulative $250 billion
Growing Cooler: What it means Meeting the growing demand for conveniently located homes in walkable neighborhoods could significantly reduce the growth in the number of miles Americans drive, shrinking the nation’s carbon footprint while giving people more housing choices
The 5D Variables • Density • Diversity (of land use mix) • Design • Destination (accessibility) • Distance (to transit)
Is there a market for walkable neighborhoods? Survey: • 6 in 10prospective homebuyers chose walkable neighborhoods with less time spent driving • African-Americans and Hispanics even more likely to prefer compact neighborhoods • Source: 2004 poll by National Association of Realtors and Smart Growth America
Balancing Our Budget • Compact development reduces infrastructure costs and saves money. • Average annual cost to service a new family of four (police, fire, highway, schools and sewer): • Compact suburban Shelby County, KY = $88.27 • Sprawling Pendleton County, KY = $1,222.39 • Sources: Brookings Institution
5 Metro Stations in Arlington, VA Undisturbed Undisturbed Undisturbed Undisturbed
Outcomes in Arlington • 73.3% of patrons walk to transit; over 58,000 trips daily • 38% of residents near stations take transit to work • 12% of Arlington County households don’t own cars--triple the regional average • Corridor produces 32.8% of the County’s real estate tax revenue from 7.6% of its land area • Arlington has the lowest property tax of any major jurisdiction in Northern Virginia Source: Reconnecting America, Hidden in Plain Sight, 2005
Priority Inventment Areas • “Affordable housing” • Purchase costs no more than 28% and rental costs no more than 30% of - 80% of area median income • “Traditional neighborhood design” – design and appearance so that functions like traditional neighborhood or town. • Reasonably high densities • Mixture of residential and commercial uses • Range of single and multi family housing types • Street connectivity within development and surrounding
PIA Definitions • “Market-based incentives” – encourage private developers to meet goals. Includes: • Density bonuses • Relaxed regulations • Reduced or waived fees • Fast-track permitting • Design flexibility
Codes/Zoning Smart Neighborhoods: model overlay ordinances designed to help local governments encourage mixed-use and compact development within the framework of conventional zoning. Maryland Smart Neighborhoods and Infill Development Models LEED-ND Mixed-Use Zoning Districts Mixed-use overlay aimed at encouraging market-driven, mixed-use development and higher-density residential projects. (ex: City of Anaheim, CA). Overlay Zones Help to establish template for high-density, mixed-use while retaining existing zoning For established single-use areas with predominately commercial, office, and retail uses to add housing element while maintaining code requirements Incentive-base Zoning (University Neighborhood Overlay in Austin, TX) Small-lot Subdivision Ordinance Streamlines subdivision and entitlement process to encourage infill development (City of Los Angeles)
SMART-CODERural-Urban Transect – The zones within the SmartCode are designed to create complete human habitats ranging from the very rural to the very urban. Where conventional zoning categories are based on different land uses, SmartCode zoning categories are based on their rural-urban character. All categories within the SmartCode allow some mix of uses. SmartCode zoning categories ensure that a community offers a full diversity of building types, thoroughfare types, andcivic space types, and that each has appropriate characteristics for its location.
Central Petaluma—SmartCode • City’s vision: system for ensuring that the design of the public realm and the design of private buildings are rigorously coordinated, and are focused on the pedestrian experience. • Pedestrian-oriented public-streets, plazas, squares and riverfront walks, lined with mixed-use, pedestrian-oriented buildings.
Central Petaluma—SmartCode To develop new, mixed-use neighborhoods with the following characteristics: • 5-minute walking distance from edge to center • Mixture of land uses includes shops, workplaces, residences, and civic buildings in proximity. • Variety of thoroughfares that serve the needs of pedestrians, cyclists and automobiles equitably; • Public open spaces that provide places for informal social activity and recreation; and • Building frontage that define the public space of each street. http://cityofpetaluma.net/cdd/cpsp.html
Smart Neighborhoods Relatively self-contained new communities with a compact mix of residential, commercial, employment/office, and civic land uses and range of housing choices, with a design that fosters pedestrian and bicycle activity, public safety, environmental protection, long-term investment, efficient use of infrastructure, and efficient provision of public services. Large infill and greenfield sites, located within priority funding areas.
Smart Neighborhoods • Efficient use of infrastructure 2. Socioeconomic diversity 3. Transportation choice 4. Environmental quality 5. Sustained economic health 6. Sense of community 7. Logical extension and integration of communities
Density Tools • Development Rating Systems “score-cards”, decision-making tool - Livable Communities Coalition in Atlanta - Smart Growth Criteria Matrix in Austin. TX • Financial Incentives Mixed-use projects carry the dual burdens of decreased certainty of approval and perceived increase in risk. In order to encourage mixed-use development, jurisdictions need to provide developers with increased certainty of approval, incentives, or a reduced share of the costs of public amenities.
INCENTIVES FOR DEVELOPERS 1. Property tax abatements 2. Grants 3. Low interest loans 4. Preferential fee structuring 5. Rebate or payback programs to ensure contiguous development. 6. Priority status for development review 7. Align capital improvement program (CIP) to ensure the provision of adequate public facilities in smart neighborhood areas.
EDUCATION • See 2030 • November 19: Brownfield Redevelopment