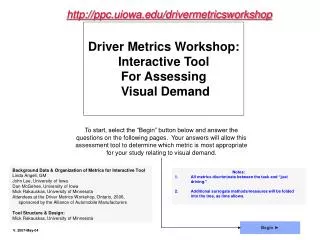
Driver Metrics Workshop: Interactive Tool For Assessing Visual Demand
The Driver Metrics Workshop provides an interactive tool designed to assess visual demand in driving through a series of questions. Participants can determine the most appropriate metrics for their studies by engaging in this assessment process. This workshop, led by experts from the University of Iowa and the University of Minnesota, aims to provide insights into the effects of various driving tasks on performance, ensuring that data collection methods are robust and reliable for future use.

Driver Metrics Workshop: Interactive Tool For Assessing Visual Demand
E N D
Presentation Transcript
http://ppc.uiowa.edu/drivermetricsworkshop Driver Metrics Workshop: Interactive Tool For Assessing Visual Demand To start, select the “Begin” button below and answer the questions on the following pages. Your answers will allow this assessment tool to determine which metric is most appropriate for your study relating to visual demand. Background Data & Organization of Metrics for Interactive Tool Linda Angell, GM John Lee, University of Iowa Dan McGehee, University of Iowa Mick Rakauskas, University of Minnesota Attendees at the Driver Metrics Workshop, Ontario, 2006, sponsored by the Alliance of Automobile Manufacturers Tool Structure & Design: Mick Rakauskas, University of Minnesota • Notes: • All metrics discriminate between the task and “just driving.” • Additional surrogate methods/measures will be folded into the tree, as time allows. Begin ►
Effects on Driving Performance What specific effects on driving performance are you interested in assessing? Event Detection Only Event Detection & Lane Keeping / Lateral Control Lane Keeping / Lateral Control & Speed Keeping / Longitudinal Control & Glance Behavior Event Detection & Lane Keeping / Lateral Control & Speed Keeping / Longitudinal Control & Glance Behavior Restart
Repeatability Are you concerned about being able to repeat your results in future testing? Yes No Restart
Repeatability Are you concerned about being able to repeat your results in future testing? Yes No Restart
Repeatability Are you concerned about being able to repeat your results in future testing? Yes No Restart
Repeatability Are you concerned about being able to repeat your results in future testing? Yes No Restart
Empirical Foundations Of these choices, what is the minimum amount of validation you expect your measures to have? Limited empirical data, or multiple studies that may not all agree It is unimportant that measures have been validated in the past. More than one study with some consistency, data have validity & applicability It is somewhat important that measures have been validated in the past. Multiple studies with cross validation, data are highly valid & consistent It is important that measures have been validated in the past. Multiple peer reviewed (published) studies, data are highly valid & consistent It is very important that measures have been validated in the past. Restart
Empirical Foundations Of these choices, what is the minimum amount of validation you expect your measures to have? Limited empirical data, or multiple studies that may not all agree It is unimportant that measures have been validated in the past. More than one study with some consistency, data have validity & applicability It is somewhat important that measures have been validated in the past. Multiple studies with cross validation, data are highly valid & consistent It is important that measures have been validated in the past. Multiple peer reviewed (published) studies, data are highly valid & consistent It is very important that measures have been validated in the past. Restart
Empirical Foundations Of these choices, what is the minimum amount of validation you expect your measures to have? Limited empirical data, or multiple studies that may not all agree It is unimportant that measures have been validated in the past. More than one study with some consistency, data have validity & applicability It is somewhat important that measures have been validated in the past. Multiple studies with cross validation, data are highly valid & consistent It is important that measures have been validated in the past. Multiple peer reviewed (published) studies, data are highly valid & consistent It is very important that measures have been validated in the past. Restart
Empirical Foundations Of these choices, what is the minimum amount of validation you expect your measures to have? Limited empirical data, or multiple studies that may not all agree It is unimportant that measures have been validated in the past. More than one study with some consistency, data have validity & applicability It is somewhat important that measures have been validated in the past. Multiple studies with cross validation, data are highly valid & consistent It is important that measures have been validated in the past. Multiple peer reviewed (published) studies, data are highly valid & consistent It is very important that measures have been validated in the past. Restart
Empirical Foundations Of these choices, what is the minimum amount of validation you expect your measures to have? Limited empirical data, or multiple studies that may not all agree It is unimportant that measures have been validated in the past. More than one study with some consistency, data have validity & applicability It is somewhat important that measures have been validated in the past. Multiple studies with cross validation, data are highly valid & consistent It is important that measures have been validated in the past. Multiple peer reviewed (published) studies, data are highly valid & consistent It is very important that measures have been validated in the past. Restart
Empirical Foundations Of these choices, what is the minimum amount of validation you expect your measures to have? Limited empirical data, or multiple studies that may not all agree It is unimportant that measures have been validated in the past. More than one study with some consistency, data have validity & applicability It is somewhat important that measures have been validated in the past. Multiple studies with cross validation, data are highly valid & consistent It is important that measures have been validated in the past. Multiple peer reviewed (published) studies, data are highly valid & consistent It is very important that measures have been validated in the past. Restart
Recommended Metrics Click the metric name for a description, lists of references, & organizations with experience. Throughout the document, R2 color coding is as follows: Green > 0.75 0.75 > Orange > 0.50 0.50 > Yellow > 0.75 Exit ► Restart
Recommended Metrics Note: These Metrics are weakly supported by your choices. Click the metric name for a description, lists of references, & organizations with experience. Exit ► Restart
Recommended Metrics Note: These Metrics are weakly supported by your choices. Click the metric name for a description, lists of references, & organizations with experience. Throughout the document, R2 color coding is as follows: Green > 0.75 0.75 > Orange > 0.50 0.50 > Yellow > 0.75 Exit ► Restart
Recommended Metrics Note: These Metrics are weakly supported by your choices. Click the metric name for a description, lists of references, & organizations with experience. Throughout the document, R2 color coding is as follows: Green > 0.75 0.75 > Orange > 0.50 0.50 > Yellow > 0.75 Exit ► Restart
Recommended Metrics Click the metric name for a description, lists of references, & organizations with experience. Throughout the document, R2 color coding is as follows: Green > 0.75 0.75 > Orange > 0.50 0.50 > Yellow > 0.75 Exit ► Restart
Recommended Metrics Click the metric name for a description, lists of references, & organizations with experience. Throughout the document, R2 color coding is as follows: Green > 0.75 0.75 > Orange > 0.50 0.50 > Yellow > 0.75 Exit ► Restart
Recommended Metrics Click the metric name for a description, lists of references, & organizations with experience. Throughout the document, R2 color coding is as follows: Green > 0.75 0.75 > Orange > 0.50 0.50 > Yellow > 0.75 Exit ► Restart
Recommended Metrics Click the metric name for a description, lists of references, & organizations with experience. Exit ► Restart
Recommended Metrics Note: These Metrics are weakly supported by your choices. Click the metric name for a description, lists of references, & organizations with experience. Throughout the document, R2 color coding is as follows: Green > 0.75 0.75 > Orange > 0.50 0.50 > Yellow > 0.75 Exit ► Restart
Recommended Metrics There were no Metrics supported by your choices. Please try again by clicking the restart button below. Exit ► Restart
Recommended Metrics Click the metric name for a description, lists of references, & organizations with experience. Exit ► Restart
Recommended Metrics Click the metric name for a description, lists of references, & organizations with experience. Exit ► Restart
Recommended Metrics Click the metric name for a description, lists of references, & organizations with experience. Throughout the document, R2 color coding is as follows: Green > 0.75 0.75 > Orange > 0.50 0.50 > Yellow > 0.75 Exit ► Restart
Recommended Metrics Click the metric name for a description, lists of references, & organizations with experience. Throughout the document, R2 color coding is as follows: Green > 0.75 0.75 > Orange > 0.50 0.50 > Yellow > 0.75 Exit ► Restart
Recommended Metrics Note: These Metrics are weakly supported by your choices. Click the metric name for a description, lists of references, & organizations with experience. Throughout the document, R2 color coding is as follows: Green > 0.75 0.75 > Orange > 0.50 0.50 > Yellow > 0.75 Exit ► Restart
Recommended Metrics There were no Metrics supported by your choices. Please try again by clicking the restart button below. Exit ► Restart
Recommended Metrics Template Click the metric name for a description, lists of references, & organizations with experience. Exit ► Restart
References (peer reviewed) Noy, Lemoine & Klachan (2002) z.B. Schutte & Trujillo (1996) Madhavan & Funk (1996) Pattipati et al (1983) Adams, Tenney & Pew (1995) Mc Farlane & Latorella (2002) Miyata & Norman (1986) z.B. Krems et al (2001) Franke, Daniels & Mc Farlane (2002) Noy & Lemoine (2001) Noy et al (2004) Special issue of Applied Ergonomics (2003) Special issue of HF (2002) (non-peer reviewed) Driver Focus-Telematics Working Group (2002) Occlusion Metrics (ISO/CD 16673) (cf. proposal 3.3 (2003) & 2.1A & SAE J2364, ISO 16673) See operational definitions for task, subtask, and dependant task:alliance guidelines v2.1, June 2006 update Description The occlusion procedure simulates visual demand in order to measure the “resumability” after a visual distraction. The longer someone is visually distracted (i.e. is keeping their eyes off the road), the greater the crash risk. The occlusion method is accomplished by blocking the participant’s view of the relevant driving scene area or cockpit areas either physically (e.g. occlusion goggles, partition) or by simulating a partition in a simulated environment for a relevant occlusion interval. Measures (abbreviations) Total Shutter Open Time (TSOT)- total time that vision is not occluded with an occlusion procedure (ISO/DIS 16673.2) Total Task Time (TTTUnoccl)- total time that gaze is fixed upon a target area (ISO/DIS 16673.2) Resumability ratio (R)- determined as the total time that vision is not occluded with an occlusion procedure (TSOT) to the total static task time (TTTUnoccl). (ISO/DIS 16673.2) Organizations with Experience CUT, BASt, TRL BMW HASTE (groups involved w/) Transport Canada JAMA JARI LAB (PSA, Renault) DRI Toyota, Ford, Nissan, GM (CAMP) Visual Occlusion Exit ► ◄ Back Restart
Description The lane change test is a simple laboratory “…dual-task method that quantitatively measures performance degradation on a primary driving-like task due to distraction while a secondary task (e.g. operating an in-vehicle system) is being performed” (ISO TC 22/SC 13/WG 8). During a test run, participants steer a simulated vehicle between three lanes as directed by signs on the side of the road placed at constant distances. Participants complete the primary task of driving while also completing a secondary task or an established criterion task, with established levels of performance (e.g. tuning a radio). Measures (abbreviations)- [if alternative measure, proposed by] Mean Deviation (Mdev)- average deviation from normative model is the total area between the normative model and driving course (m2) divided by distance driven (m) Adaptive Mdev – Mean deviation adjusted on a per-individual basis [Tattegrain Veste, INRETS] Missed lane changes - count of lane changes missed [Burns, Transport Canada] Mean task completion time (or distance) - average time(s) it takes to complete a single task while driving the LCT [Burns, Transport Canada] Standard Deviation of lane position (Sdev Lpos) Mean area of deviation per task - average area between the normative model and driving course (m2) for a single task [Burns, Transport Canada] Lane change initiation (LCI; event detection) - time from when sign appears until initial change from current lane position [Burns, Transport Canada] Total (sum) delay in initiation by task - the mean sum of the delays in LCI for a single task (m) [Burns, Transport Canada] References (non-peer reviewed) Mattes (2003) Markkula, Engstrom (in prep) Burns et al (2005) CAMP Driver WL Metrics Project (2005) Organizations with Experience Daimler Chrysler (& many more) JARI VTI (Swedish national Transport Research Institute) collaborating on HASTE & AIDE projects USDOT, GM, Ford, Toyota, Nissan (CAMP driver WL Metrics project) Honda Transport Canada Volvo INRETS LAB BMW DRI Lane Change Test Exit ► ◄ Back Restart
References (peer reviewed) Bowyer, Moran, Hsieh, Manhoran, Young, et al (2006) Corbetta (1998) Engstrom, Johansson, Ostlund (2005) HASTE special issue (all papers from WP2 studies) Victor, Harbluk, Engstrom (2005) Young & Angell (2003) (non-peer reviewed) Johnsson, Engstrom, et al (2004) Johansson, Kronberg, et al (2006) Kronberg, Victor, Engstrom (2006) Larsson (2002) Markkula, Engstrom (in press) Ostlund, Peters, et al (2005) Victgor (2005) CAMP Driver WL Metrics Project (2005) Organizations with Experience HASTE & AIDE projects USDOT, GM, Ford, Toyota, Nissan (CAMP driver WL Metrics project) VTTI (Virginia Tech Transportation Institute) University of Iowa … and many more Description Direct measures assess how drivers respond to vehicle and equipment design, the road environment, or other driver related tasks in both real and simulated road conditions. Behavior is quantified relative to reference task(s) through response & performance measures and gaze metrics (and by inference, attention processes). Measures (abbreviations) Number of glances - count of glances that are aimed at a target object or area Total Glance Time (T-G-T) - time(s) that gaze is attending to a target object or area (aka “Eyes Off Road Time (E-O-R-T)”) Glance Duration - length of time (s) that a glance remains on a target object or area Rate - percent of glance duration spent on a target (task) object or area Use with a driving methodology yields driving performance data, e.g. Lane position variation Lane exceedance counts Speed variability Object or event reaction times Glances Measured in Static or Dynamic Divided Attention Test, Including PDT Exit ► ◄ Back Restart
Description The Sternberg test requires individuals to memorize a short list of numbers. Numbers are then presented (visually, aurally), and the participant must answer "yes" or "no" depending on whether each is a member of the memorized set. References To be supplied Organizations with Experience GM Others to be supplied Sternberg Test Exit ► ◄ Back Restart