Download

1 / 0
Kentucky Retirement Systems Overview
0 likes | 162 Vues
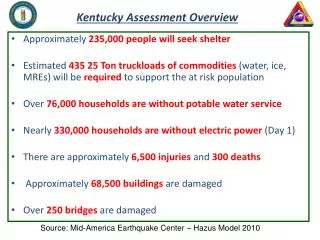
Kentucky Retirement Systems Overview. Presented to the Central Kentucky AGA September 12, 2013. Kentucky Retirement Systems (KRS) Facts. KRS administers retirement benefits for more than 334,000 state and local government employees
Télécharger la présentation 
Kentucky Retirement Systems Overview
An Image/Link below is provided (as is) to download presentation
Download Policy: Content on the Website is provided to you AS IS for your information and personal use and may not be sold / licensed / shared on other websites without getting consent from its author.
Content is provided to you AS IS for your information and personal use only.
Download presentation by click this link.
While downloading, if for some reason you are not able to download a presentation, the publisher may have deleted the file from their server.
During download, if you can't get a presentation, the file might be deleted by the publisher.
E N D
Presentation Transcript
-
Kentucky Retirement Systems Overview
Presented to the Central Kentucky AGA September 12, 2013 - Kentucky Retirement Systems (KRS) Facts KRS administers retirement benefits for more than 334,000 state and local government employees These employees include state employees, state police officers, city and county employees, local agency employees, and nonteaching staff of local school boards and regional universities. KRS administers three plans: Kentucky Employees Retirement System (KERS) KRS 61.510 to 61.705 and KY Administrative Regulations, Title 105 County Employees Retirement System (CERS) KRS 78.510 to 78.852 and KY Administrative Regulations, Title 105 State Police Retirement System (SPRS) KRS 16.505 to 16.652 and KY Administrative Regulations, Title 105
- Plan Administration A thirteen-member Board of Trustees administers the Systems: Two trustees elected by KERS members Three trustees elected by CERS members One trustee elected by SPRS members Six trustees appointed by the Governor One must be knowledgeable about the pension requirements on local governments Two must have at least 10 years of investment experience One each from lists of nominees submitted by the KY League of Cities, the KY Association of Counties, and the KY School Boards Association The Secretary of the Kentucky Personnel Cabinet, ex officio The Board appoints an Executive Director to act as the Chief Administrative Officer of the Board KRS reports for budget purposes to the Kentucky General Assembly
- Plan Administration The following standing committees are created in the bylaws of the KRS Board of Trustees: Administrative Appeals Committee Disability Appeals Committee Audit Committee Investment Committee Legislative and Budget Committee Human Resources Committee Retiree Health Committee Legal, Compliance and Governance Committee The members and the chair of each standing committee are appointed by the chair of the KRS Board of Trustees The chair of the KRS Board of Trustees or the Board may also create ad hoc committees, as needed
- KRS Membership by System and Status As of June 30, 2012 TOTAL 87,472 107,353 139,352 Source: June 30, 2012 Comprehensive Annual Financial Report
- KRS Current Assets and Benefit Payments As of March 31, 2013 KRS assets were $14.7 billion KRS pays $2 billionin pension and insurance benefits each year 95% of benefit payments are delivered to Kentucky residents and have a significant impact on the Kentucky economy Source: June 30, 2012 Comprehensive Annual Financial Report
- How is KRS Funded? There are three (3) sources of funding for Kentucky Retirement Systems: Employee Contributions: Set by statute Employer Contributions: Set annually by the KRS Board of Trustees based on an independent actuarial valuation and recommendation Return on Investments The KRS Investment Committee has the authority to make investment decisions and hire external investment managers and consultants KRS utilizes internal investment staff, external investment managers, and independent investment consultants to conduct the investment program
- How is KRS Funded? The Majority of KRS Funding Comes fromReturn on Investments Employee 12% Employer 20% Investment Income 68% NOTE: These figures were calculated using only the PENSION fund data found in the June 30, 2011 Comprehensive Annual Financial Report
- Public Pension Fund Revenue Sources United States, 1982 to 2009 Sources: US Census Bureau and the National Association of State Retirement Administrators (NASRA Issue Brief: Public Pension Plan Investment Returns, published October 2011). The US Census Bureau first began reporting public pension fund revenue data in 1982.
- Actuarial Basics Funding Level Ratio of Actuarial Assets to Actuarial Liabilities Measure of the plan’s financial soundness Provides a “snapshot” of the plan’s ability to meet liabilities (benefits) earned to date Actuarial funding level is based on a 5-year smoothing method
- Actuarial Basics Summary of Actuarial Funding Level (2007 – 2012) Source: June 30, 2012 Comprehensive Annual Financial Report
- Actuarial Basics Summary of Actuarial Funding Level (2007 – 2012) Source: June 30, 2012 Comprehensive Annual Financial Report
- Actuarial Basics Summary of Actuarial Funding Level (2007 – 2012) Source: June 30, 2012 Comprehensive Annual Financial Report
- Actuarial Basics Summary of Actuarial Funding Level (2007 – 2012) Source: June 30, 2012 Comprehensive Annual Financial Report
- Actuarial Basics Summary of Actuarial Funding Level (2007 – 2012) Source: June 30, 2012 Comprehensive Annual Financial Report
- Actuarial Basics Summary of Actuarial Funding Level (2007 – 2012) Source: June 30, 2012 Comprehensive Annual Financial Report
- Actuarial Basics Summary of Actuarial Funding Level (2007 – 2012) Source: June 30, 2012 Comprehensive Annual Financial Report
- Actuarial Basics Summary of Actuarial Funding Level (2007 – 2012) Source: June 30, 2012 Comprehensive Annual Financial Report
- Actuarial Basics Summary of Actuarial Funding Level (2007 – 2012) Source: June 30, 2012 Comprehensive Annual Financial Report
- Actuarial Basics Summary of Actuarial Funding Level (2007 – 2012) Source: June 30, 2012 Comprehensive Annual Financial Report
- Actuarial Basics Unfunded Actuarial Liability (UAL) Difference between current value of assets and liabilities Represents liabilities on benefits already earned by employees and retirees UAL is amortized over a 30 year or shorter period, much like a home mortgage The amortized payment is a part of the employer contribution rate
- KERS/SPRS 2012 Unfunded Liabilities(in billions of dollars) 2012 2011 Source: June 30, 2011 and June 30, 2012 Actuarial Valuations
- CERS 2012 Unfunded Liabilities(in billions of dollars) 2012 2011 Source: June 30, 2011 and June 30, 2012 Actuarial Valuations
- What Caused the Increase in Unfunded Liabilities? Reductions to Employer Contribution Rates in KERS and SPRS $2.86 billion contribution shortfall over the past 20 years Cost Inflation for Retiree Insurance GASB 43/45 Benefit Enhancements Retiree COLA increases not pre-funded 2000-2002 and 2008-2009 Market Losses
- KERS Unfunded Liability Attribution Chart prepared by Cavanaugh & McDonald Consulting LLC
- What Action Has Already Been Taken to Address These Issues? 2004 Changes: Employees hired on or after July 1, 2003 earn health insurance benefits based upon dollar value Non-Hazardous: $10/month for each year of actual service Hazardous: $15/month for each year of actual service Purchases Purchases after 8/1/2004 do not count towards vesting for health insurance benefits Purchases made by new hires after 8/1/2004 will not count towards vesting for retirement eligibility Purchase factor methodology reviewed and amended in 2005
- What Action Has Already Been Taken to Address These Issues? 2006 Actuarial Experience Study: Modified actuarial assumptions related to retiree health premium increases, retirement rates, and life expectancies will increase rates Eventually, GASB 43/45 and changes in actuarial assumptions (including the expected continuation of retiree health premium inflation) and COLAs will exceed changes made to stabilize rates
- What Action Has Already Been Taken to Address These Issues? 2008 Changes: House Bill 1 (2008 Special Session) made significant changes to retirement benefits for employees who begin participating with KRS on or after September 1, 2008 HB 1 also had provisions affecting current employees and retirees COLA at 1.5% instead of based on CPI-U Service Purchase costs now include COLA and are calculated on earliest retirement date member can retire with an unreduced benefit Retired/reemployed changes for employees returning to work on or after September 1, 2008 regardless of the employee’s retirement date HB 1 amended KRS 61.565 to create a phase-in schedule for paying 100% of the Actuarially Required Contribution rates If the General Assembly adheres to the schedule, all participating agencies will be required to pay the full employer contribution by 2025
- Senate Bill 2 (2013) Funding Provisions 100% of Actuarially Required Contribution (ARC) for KERS and SPRS beginning FY 2015 No COLAs unless: 1) Pre-funded; 2) KRS determines plan surplus so that COLA will not reduce funding below 100% Pension Spiking Prohibited Hybrid Cash Balance Plan
- KENTUCKY RETIREMENT SYSTEMS INVESTMENT PROGRAM
- Transparency / Web Site Update Address: www.kyret.ky.gov Information available: Latest Investment Performance Information and News Consultant Reports (new) Board and staff contact info 5 years of Comprehensive Annual Financial Reports 5 years of Annual Financial Statements 5 Years of Audits Corporate Documents and Policies Committee Assignments Board and Committee Meeting Dates, Agendas, and Minutes Investment Holdings and Commissions Sections for Actives and Retirees ……. and more
- Staff Educational Qualifications (10 staff) Traditional Education – Advanced Degrees 7 MBA’s 2 MS Finance Industry Certifications 2 Chartered Financial Analyst (CFA) Charter holder 3 CFA Candidates (6 covered by CFA Code of Ethics) 4 Chartered Alternative Investment Analysts (CAIA) 1 CAIA Candidate 1 Certified Treasury Professional (CTP) 1 CTP Candidate 1 Financial Risk Manager (FRM) 1 Financial Risk Management Candidate Designations previously held: Licensed International Financial Analyst (LIFA), 6,7,63,65, Life and Annuity, Chartered Mutual Fund Counselor
- Asset Allocation Targets (Effective January 1, 2013)
- Pension Asset Allocation Statistics As of March 31, 2013
- Fiscal and Calendar Year Pension Returns
- Performance as of: March 31, 2013
- Bay Hills Emerging Partners III Preliminary 2013 Plan Allocations Pension Insurance $ Plan Allocation $ Plan Allocation KERS ¹ - 0.0000% 7,520,000 18.2400% KERSH ² 4,710,000 5.9811% 4,170,000 10.1000% CERS 55,160,000 70.0420% 18,210,000 44.1500% CERSH 17,190,000 21.8258% 9,850,000 23.8800% SPRS 1,690,000 2.1511% 1,500,000 3.6300% Total $ 78,750,000 100.00% $ 41,250,000 100.00% Note: The information above is presented based on the proposed contractual structure for the initial three years of the program. Investment Allocation Examples
- Investment Allocation Examples (con’t)
- Investment Expense Allocations All investment management costs are allocated at the individual manager level and are therefore only paid by a system, or the systems, that have an allocation to that specific investment manager. As each Retirement Plans ownership percentage of every underlying manager is known, when investment management fees are paid from the individual account, each plan pays only their proportionate share. Administrative expenses are allocated based on each plans individual membership count divided into the total KRS member count and is changed on an annual basis.


More Related