Total Suspended Matter Algorithm for the Chesapeake Bay Waters
110 likes | 294 Vues
Total Suspended Matter Algorithm for the Chesapeake Bay Waters. SeungHyun Son 1,2 and Menghua Wang 1 1 NOAA/NESDIS/STAR Camp Springs, MD 2 I.M. Systems Group, Rockville, MD. Total Suspended Solid/Matter. Total Suspended Matter (TSM) Total Suspended Solid (TSS)

Total Suspended Matter Algorithm for the Chesapeake Bay Waters
E N D
Presentation Transcript
Total Suspended Matter Algorithm for the Chesapeake Bay Waters • SeungHyun Son1,2 and Menghua Wang1 • 1NOAA/NESDIS/STAR Camp Springs, MD • 2I.M. Systems Group, Rockville, MD
Total Suspended Solid/Matter Total Suspended Matter (TSM) Total Suspended Solid (TSS) Total Suspended Particulate Matter (SPM) Solids in water that can be trapped by a filter. TSS includes suspended sediments and organic materials such as silt, decaying plant and animal matter, and so on. (USGS).
Measurement method of TSM • In general, samples are filtered through preweighed 0.4 μm polycarbonate filters. The filters are washed with three 2.5 mL - 5.0 mL aliquots of DIW and immediately dried, either in an oven at 75°C, or in a dessicator. The filters are then reweighed in a laboratory, back on shore, using an electrobalance with at least seven digits of precision (Strickland & Parsons, 1972; NASA OBPG standard protocol). • 500 mL of water was filtered under vacuum through a pre-washed, dried, and weighed GF/F filter (0.7-µm pore size, 47-mm diameter). Smaller volumes were filtered when high concentrations of particulates were present. After the sample filter was washed and excess water was removed under suction, the filter was stored for a maximum of seven days at 4°C or cooler. The sample filter was then dried in a 104°C (±1°C) oven for at least 1 h, cooled in a desiccator, and weighed. The cycle of drying, cooling, and re-weighing was repeated until no significant change in weight (≤0.5 mg) was observed between successive weighings. The detection limit for the TSS analyses was 2 mg L-1, and the practical range of application was 2 to 20,000 mg L-1 (Chesapeake Bay Program, 1996).
TSM models Tassan(1994) Clark (2003) c=[0.49033, -2.712882, 3.412666, -8.336478, 12.111023, -5.961926] Miller & McKee (2002)
TSM models (continued) D’Sa (2007) Zhang et al. (2010) Zawada et al. (2007) - Semi-Analytical model Where 2 < TSM < 50 mg/liter
Model Approaches for TSM algorithm in CB • Single band and multiple band ratios. • Backscattering coefficients (Wang et al., 2009) • Diffuse attenuation coefficient
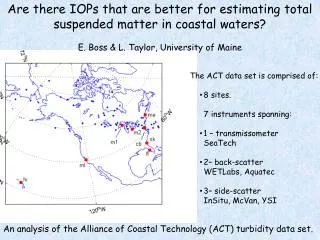
Chesapeake Bay with locations of in-situ measurements obtained from the NASA SeaBASS and the Chesapeake Bay Program Office.
In situTSM data are compared with inversely-derived (top) bb(490) and (bottom) bb(555) data (Wang et al., 2009) obtained from the NASA SeaBASS database.
In situ TSM measurements are compared with the diffuse attenuation coefficients, Kd(PAR) (from the Chesapeake Bay Program Office Database).
Future work • To evaluate the models with more available in situ measurements in the Chesapeake Bay waters. • To apply updated models into the MODIS data derived using NIR-SWIR atmospheric correction algorithms. • To compare the MODIS-derived TSM measurements with the in situ TSM.