Download

1 / 16
160 likes | 259 Vues
Overweight and Diabetes in the Canadian Population. By: Ismail El-Salfiti and Shayan Obaidullah J.S. Woodsworth High School. Table Of Contents. - Introduction - Analyzing data involving one variable - Analyzing data involving two variables - Conditional Probability

E N D
Overweight and Diabetes in the Canadian Population By: Ismail El-Salfiti and Shayan Obaidullah J.S. Woodsworth High School
Table Of Contents - Introduction - Analyzing data involving one variable - Analyzing data involving two variables - Conditional Probability - Project on Simulation and Normal Distribution - Hypothesis Testing - Major Conclusion
Introduction • Topic - “Do people who are overweight have a greater chance of developing diabetes?” • Thesis: Canadians who are overweight (BMI>27) have an increased chance of developing diabetes. • Variables – Overweight (BMI) Diabetes • Units:- Body Mass Index (kg/m2) & formula= weight/height2 - Diabetes % (#diabetes/ #population) • Sources: • Canadian Institution for Health Information • Health Canada
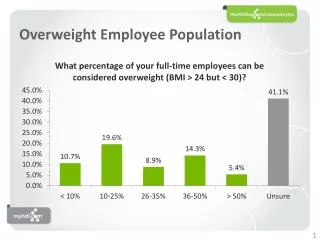
Analyzing Data Involving One Variable Overweight % in Canada Overweight % in Canada (Gender) • Increase in percentages of people who are • overweight as age intervals increase (20 • to 64). • It shows a positive regression in the • percentages and that the highest • percentage of overweight people is in the • 55-64 age group (Ratio: ~ 2.4). • Probability of a male being overweight is • higher than a female in all age groups. • The claim that males are more likely to be • overweight than females is true and consistent • with the other years as well.
Analyzing Data Involving One Variable Diabetes % in Canada Diabetes % in Canada (Gender) • For the most part, males have a higher chance of being diabetic than females. This claim is consistent with the other years. • The only exceptions are in the 25-34 and 35-44 age groups for females because of gestational diabetes perhaps. • It shows an increase in percentages of people who have diabetes as age interval increases (20 to 75+). • The probability of having diabetes is ~ 22.8 times more if you are in the 75 + age interval in comparison to the 20-24 age group.
Analyzing Data Involving Two Variables 1. Linear and Quadratic Relations: • The above graph shows a quadratic • relationship between time and • diabetes % in Canada. • It is a very strong quadratic • correlation that fits the data perfectly. • This statistic means that diabetes in Canada will likely increase in a quadratic form. • The above graph shows a linear • relationship between time and • overweight % in Canada. • The trend shows that the overweight • % in Canada will continue to rise in a • linear relationship. • Predicting the overweight % for 2004: • 33.82% [Y= 0.53(2004)- 1028.3]
Analyzing Data Involving Two Variables • The above graph shows a quadratic • relationship between age and diabetes % in Canada. • The graph shows that as age interval • increases, the percentage of diabetic people in that age interval is higher. • This implies that the probability of • having diabetes also increases as age • increases. • The above graph shows a quadratic • relationship between age and overweight • % in Canada. • The graph shows that as age interval • increases, the percentage of overweight • people in that age interval is higher. • This implies that the probability of being • overweight increases as age increases.
Analyzing Data Involving Two Variables 2. Defining Relationship Between Overweight and Diabetes: • This graph shows the relationship between weight and diabetes. • 58.7 % of Canadians who have diabetes are also overweight (BMI>27). • While, 32.3 % of people who do not have diabetes are overweight.
Conditional Probability • The weighted mean of overweight people in the Canadian population between 35 to 64 yrs of age is 31.92%. The probability of being overweight for an individual who is between 35 and 64 yrs old is 0.3192. • The weighted mean of diabetes in the Canadian population between 35 to 64 yrs of age is 3.28%. The probability of being diabetic for an individual in this age group is 0.0328. • P(Dia with Over)= 0.5870 • Therefore, the percentage of the population (35-64) that have diabetes and are overweight is 1.93%. P(Diabetes & Overweight) = 0.0193 • Equation for calculating the probability of having diabetes given overweight: P(Diabetes | Overweight) = P(Diabetes Overweight) P(Overweight) • The probability of having diabetes given overweight is 0.0605.
Project on Simulation and Normal Distribution • We will be conducting two simulations to determine the validity of the statistics. • We will use the results from the simulations to conduct hypothesis testing. • We will be simulating the gender distribution of overweight— males and females proportions in 1996/97. • In each simulation we will be looking for the mean and standard deviation for the data accumulated. • Original Probabilities: • Males’ overweight proportion= 61.1% • Females’ overweight proportion = 38.9%
Project on Simulation and Normal Distribution • The simulation is based on binomial data for both the males’ and females’ overweight distributions. • In general, there are two outcomes: successes and • failures. • We can also assume that the outcomes are • independent which suggests a Binomial Probability • model. • The two graphs seem to be normally distributed because they both form a near symmetrical mound shape. • Females’ Overweight Distribution: - Mean = 39.23 (derived from simulation) - 4.88 [ = (npq)] • Males’ Overweight Distribution: • - Mean = 61.22 • - 4.88
Project on Simulation and Normal Distribution • Let represent the mean (np). This mean will be the mean outputted from the simulation. i. Females’ Overweight Distribution 68 %: +/- 1 95 %: +/- 2 = 39.23 + 4.88 or 39.23 - 4.88 = 39.23 + 2(4.88) or = 39.23- 2(4.88) 44.1 34.4 50.0 29.5 99.7 %: +/- 3 = 39.23 + 3(4.88) or 39.23- 3(4.88) 53.9 24.6 ii. Males’ Overweight Distribution 68 %: +/- 1 95 %: +/- 2 = 61.22 + 4.88 or 61.22 - 4.88 = 61.22 + 2(4.88) or = 61.22- 2(4.88) 66.1 56.3 71.0 51.5 99.7 %: +/- 3 = 61.22 + 3(4.88) or 61.22- 3(4.88) 75.9 46.6
Project on Simulation and Normal Distribution Conclusion • In samples of 100 overweight people each: - 68% of these samples will contain between 34 and 44 females who are overweight. • - 95% of these samples will contain between 30 and 50 females who are overweight. • - 99.7% of these samples will contain between 25 and 54 females who are overweight. • - 68% of these samples will contain between 56 and 66 males who are overweight. • - 95% of these samples will contain between 52 and 71 males who are overweight. • - 99.7% of these samples will contain between 47 and 76 males who are overweight.
Hypothesis Testing i. Females’ Overweight Distribution Binomial Data: - success or failure - independent Let Random Variable ‘’ represent the number of overweight females (mean). n=100, = 39.23, p= 0.3890, q= 0.6110, = 0.05 39.23 Check validity: np = 100(0.3890) nq = 100(0.6110) = 38.9 = 61.1 Therefore, a normal approximation is valid since np & nq 5. H0: p= 0.3890 [= 38.9] H1: p > 0.3890 [ > 38.9] Need , , x: = 38.9 = (npq) x= ____ 4.88 (n) = _4.88_ (100) 0.488 B.D. N.D. P( > 39.23) = P( > 39.235) = 1- P( < 39.235) = 1- P(z < 39.235 – 38.9 ) 0.488 1- P(z < 0.69) 1- 0.7549 0.2451 • P( > 39.23) is 0.2451 > = 0.05, therefore accept H0 since the probability of H1 is not rare enough.
Hypothesis Testing ii. Males’ Overweight Distribution Let Random Variable ‘’ represent the number of overweight males (mean). n=100, = 61.22, p= 0.6110, q= 0.3890, = 0.05 61.22 Check validity: np = 100(0.6110) nq = 100(0.3890) = 61.1 = 38.9 Therefore, a normal approximation is valid since np & nq 5. H0: p= 0.6110 [= 61.1] H1: p > 0.6110 [ > 61.1] Need , , x: = 61.1 = (npq) x= ____ 4.88 (n) = _4.88_ (100) = 0.488 B.D. N.D. P( > 61.22) = P( > 61.225) = 1- P( < 61.225) = 1- P(z < 61.225 – 61.1) 0.488 1- P(z < 0.26) 1- 0.6026 0.3974 • P( > 61.22) is 0.3974 > = 0.05, therefore accept H0 since the probability of H1 is not rare enough.
Major Conclusion • Our statistics does prove the thesis that people who are overweight (BMI> 27) have an increased chance of developing diabetes. • This does not mean that overweight is the only risk factor that leads to diabetes but is an important one. • 58.7 % of Canadians who have diabetes are overweight (BMI>27), while 32.3 % of people who do not have diabetes are overweight. • The conditional probability of developing diabetes given you are overweight (35-64 yrs) is 0.0605 or 6.05%. • The probability of being overweight and/or diabetic is increased in a non-linear regression with age. • Our project does predict a linear increase of overweight people in Canada and along with that a quadratic increase in diabetes % in Canada based on the trends from 1994/95 to 2000/01. • Overweight is a definite risk factor for having diabetes and possibly other diseases. “Watch out for your weight!”