Download
1 / 20
200 likes | 309 Vues
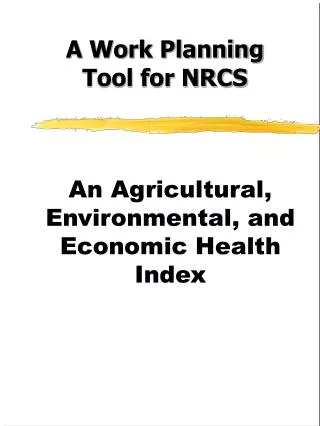
A Work Planning Tool for NRCS. An Agricultural, Environmental, and Economic Health Index. Why is it needed?. Workforce Budgets Time Demands. Data Rich, Information Poor. How can we efficiently use the large databases we have accumulated.

E N D
A Work Planning Tool for NRCS An Agricultural, Environmental, and Economic Health Index
Why is it needed? Workforce Budgets Time Demands
Data Rich,Information Poor • How can we efficiently use the large databases we have accumulated. • How do we interpret the data and turn it into action.
Potential Uses • Regional Workload Analysis • Locate Critical Needs Areas (Scale Dependent) • Evaluate Needs (Agronomic Vs. Economic) • Evaluate Conservation Practices and ACSs • Monitor Progress • Sell Conservation
Gomez Method... Developed for the evaluation of On-Farm Sustainability in the Philippines. Two Requirements: • Resource Conservation. • Farmer Satisfaction.
Gomez Indicators & Thresholds • Yield: 20% > average • Profit: 20% > average • Frequency of Crop Failure:20% or avg. whichever is lower • Soil Thickness: avg. of soil type • Percent Organic Matter: 1% or avg. whichever is higher • Permanent Cover:15% or avg. whichever is higher
Scoring Results Data for an indicator is compared to the threshold as a ratio where meeting the threshold will score 1. Example: Yield=30 Threshold=40 Score= 30/40=0.75
Scoring Results Indicators are then totaled and divided by #of indicators with 1 as ‘Healthy’ Example: Farmer Needs Yield=0.75 Profit=0.95 %Failure=1.2 Score= 0.97 * The same is done for the resource.
Applying Method to NRCS and Planning • Scale: Farm, county, watershed, MLRA, or Region • Goal: ACS, Performance, Workloads, Policy, Initiatives • Data Available: NRI, NASS, CTIC, etc. • Time
Indicators • Available in databases • Respond to changes in Management • Have logical boundaries or thresholds to separate ‘Good’ from ‘Bad’ • Directly related to the Health of the Resources and the Needs of the Land Owners/ Public.
Thresholds • Minimum Acceptable Value • MLRA or Community Average • Can be determined by policy, science, or personal biases / preferences
Threshold: Examples • Strategic Plan:50% of all US cropland will be managed by systems that improve soil quality. • Permanent Cover: Selected for ecologists viewpoint as necessary for biodiversity, wildlife habitat, carbon sinks, and low potential NPS
County Comparison Land Treatment
County Comparison Land Treatment
County Comparison Land Treatment
Benefits • NRCS Regional and State Planners can use this tool to assist their decision making process for: • Identifying under and over achieving areas (based on Strategic Plan). • Assessing workloads and personnel distribution. • Evaluating ACSs and other conservation practices.