Download
1 / 1
10 likes | 170 Vues
Fluency in Information Technology By Tessa Hustead. Working With Photoshop. Programming In Scratch. Scratch is a software that is supposed to be for beginners who want to learn how to program. It contains user-friendly graphics and colorful buttons in an attempt to make programming fun.

E N D
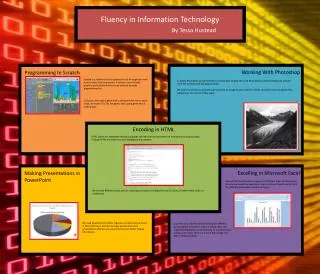
Fluency in Information Technology By Tessa Hustead Working With Photoshop Programming In Scratch Scratch is a software that is supposed to be for beginners who want to learn how to program. It contains user-friendly graphics and colorful buttons in an attempt to make programming fun. In Scratch, we made a game with a character that has to catch a ball, we made a Tic Tac Toe game, and a pong game that is multi-player. In Adobe Photoshop we learned how to manipulate images. We used Photoshop to airbrush Madonna and get rid of her wrinkles and her gapped tooth. We also learned how to animate and sequence an image to give a before, middle, and after look to a glacier that melted over the course of fifty years. Encoding in HTML HTML stands for Hypertext Markup Language. We learned the importance of nesting and closing our tags. Through HTML we made our own webpage and a calendar. Excelling in Microsoft Excel Making Presentations in PowerPoint We used Microsoft Excel to organize all different types of information. We analyzed water temperatures near La Jolla and used Excel to track the differences between months and years. We learned different codes such as color tags and ways to change the size of a font, or make it bold, italic, or underlined. We used PowerPoint to better organize our data that we found in Microsoft Excel, and also to make posters and other presentations that we can use in the future to better display information. Excel was also used for demonstrating the different demographics of students who are taking CSE3. We organized information on Excel based on academic year, college, and major. There are a lot of Psychology and Sixth College students!