Download
1 / 37
370 likes | 498 Vues
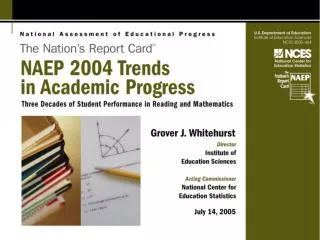
The 2004 NAEP Long-Term Trend Report provides a detailed analysis of reading proficiency among students aged 9, 13, and 17 from 1971 to 2004. It highlights significant increases in average reading scores across all ages while also addressing racial and ethnic disparities in performance, particularly between White, Black, and Hispanic students. The data reveals crucial insights into educational trends, with implications for policy and practice in educational assessment. This report is essential for educators, policymakers, and researchers concerned with improving student achievement.

E N D
Trends in average reading scale scores for students age 9, 13, and 17: 1971–2004 * Significantly different from 2004. SOURCE: U.S. Department of Education, Institute of Education Sciences, National Center for Education Statistics, National Assessment of Educational Progress (NAEP), 1971–2004 Long-Term Trend Reading Assessments. 5
Reading—Age 9 ÇAverage scores increased. * Data for Hispanic students are included in the overall national results but not reported as a separate racial/ethnic category in 1971. Therefore, the results for Hispanic students are from 1975. SOURCE: U.S. Department of Education, Institute of Education Sciences, National Center for Education Statistics, National Assessment of Educational Progress (NAEP), 1971–2004 Long-Term Trend Reading Assessments. 6
White/Black Reading Gaps: 9 *Significantly different from 2004. 1 White average scale score minus Black average scale score. NOTE: Score gaps are calculated based on differences between unrounded average scale scores. SOURCE: U.S. Department of Education, Institute of Education Sciences, National Center for Education Statistics, National Assessment of Educational Progress (NAEP), 1971–2004 Long-Term Trend Reading Assessments. 7
White/Hispanic Reading Gaps: 9 *Significantly different from 2004. 1 White average scale score minus Hispanic average scale score. 2 Data for Hispanic students are included in the overall national results but not reported as a separate racial/ethnic category in 1971. NOTE: Score gaps are calculated based on differences between unrounded average scale scores. SOURCE: U.S. Department of Education, Institute of Education Sciences, National Center for Education Statistics, National Assessment of Educational Progress (NAEP), 1971–2004 Long-Term Trend Reading Assessments. 8
Reading—Age 13 ÇAverage scores increased. ÁÂAny change in average scores was not statistically significant. * Data for Hispanic students are included in the overall national results but not reported as a separate racial/ethnic category in 1971. Therefore, the results for Hispanic students are from 1975. SOURCE: U.S. Department of Education, Institute of Education Sciences, National Center for Education Statistics, National Assessment of Educational Progress (NAEP), 1971–2004 Long-Term Trend Reading Assessments. 9
White/Black Reading Gaps: 13 *Significantly different from 2004. 1 White average scale score minus Black average scale score. NOTE: Score gaps are calculated based on differences between unrounded average scale scores. SOURCE: U.S. Department of Education, Institute of Education Sciences, National Center for Education Statistics, National Assessment of Educational Progress (NAEP), 1971–2004 Long-Term Trend Reading Assessments. 10
White/Hispanic Reading Gaps: 13 *Significantly different from 2004. 1 White average scale score minus Hispanic average scale score. 2 Data for Hispanic students are included in the overall national results but not reported as a separate racial/ethnic category in 1971. NOTE: Score gaps are calculated based on differences between unrounded average scale scores. SOURCE: U.S. Department of Education, Institute of Education Sciences, National Center for Education Statistics, National Assessment of Educational Progress (NAEP), 1971–2004 Long-Term Trend Reading Assessments. 11
Reading—Age 17 ÇAverage scores increased. ÁÂAny change in average scores was not statistically significant. * Data for Hispanic students are included in the overall national results but not reported as a separate racial/ethnic category in 1971. Therefore, the results for Hispanic students are from 1975. SOURCE: U.S. Department of Education, Institute of Education Sciences, National Center for Education Statistics, National Assessment of Educational Progress (NAEP), 1971–2004 Long-Term Trend Reading Assessments. 12
White/Black Reading Gaps: 17 *Significantly different from 2004. 1 White average scale score minus Black average scale score. NOTE: Score gaps are calculated based on differences between unrounded average scale scores. SOURCE: U.S. Department of Education, Institute of Education Sciences, National Center for Education Statistics, National Assessment of Educational Progress (NAEP), 1971–2004 Long-Term Trend Reading Assessments. 13
White/Hispanic Reading Gaps: 17 *Significantly different from 2004. 1 White average scale score minus Hispanic average scale score. 2 Data for Hispanic students are included in the overall national results but not reported as a separate racial/ethnic category in 1971. NOTE: Score gaps are calculated based on differences between unrounded average scale scores. SOURCE: U.S. Department of Education, Institute of Education Sciences, National Center for Education Statistics, National Assessment of Educational Progress (NAEP), 1971–2004 Long-Term Trend Reading Assessments. 14
Students Are Reading More *Significantly different from 2004. NOTE: Detail may not sum to totals because of rounding. SOURCE: U.S. Department of Education, Institute of Education Sciences, National Center for Education Statistics, National Assessment of Educational Progress (NAEP), 1984, 1999, and 2004 Long-Term Trend Reading Assessments. 15
Trends in average mathematics scale scores for students age 9, 13, and 17: 1973–2004 * Significantly different from 2004. NOTE: Dashed lines represent extrapolated data. SOURCE: U.S. Department of Education, Institute of Education Sciences, National Center for Education Statistics, National Assessment of Educational Progress (NAEP), 1973–2004 Long-Term Trend Mathematics Assessments. 16
Mathematics—Age 9 ÇAverage scores increased. SOURCE: U.S. Department of Education, Institute of Education Sciences, National Center for Education Statistics, National Assessment of Educational Progress (NAEP), 1973–2004 Long-Term Trend Mathematics Assessments. 17
White/Black Math Gaps: 9 *Significantly different from 2004. 1 White average scale score minus Black average scale score. NOTE: Dashed lines represent extrapolated data. Score gaps are calculated based on differences between unrounded average scale scores. SOURCE: U.S. Department of Education, Institute of Education Sciences, National Center for Education Statistics, National Assessment of Educational Progress (NAEP), 1973–2004 Long-Term Trend Mathematics Assessments. 18
White/Hispanic Math Gaps: 9 *Significantly different from 2004. 1 White average scale score minus Hispanic average scale score. NOTE: Dashed lines represent extrapolated data. Score gaps are calculated based on differences between unrounded average scale scores. SOURCE: U.S. Department of Education, Institute of Education Sciences, National Center for Education Statistics, National Assessment of Educational Progress (NAEP), 1973–2004 Long-Term Trend Mathematics Assessments. 19
Mathematics—Age 13 ÇAverage scores increased. SOURCE: U.S. Department of Education, Institute of Education Sciences, National Center for Education Statistics, National Assessment of Educational Progress (NAEP), 1973–2004 Long-Term Trend Mathematics Assessments. 20
White/Black Math Gaps: 13 *Significantly different from 2004. 1 White average scale score minus Black average scale score. NOTE: Dashed lines represent extrapolated data. Score gaps are calculated based on differences between unrounded average scale scores. SOURCE: U.S. Department of Education, Institute of Education Sciences, National Center for Education Statistics, National Assessment of Educational Progress (NAEP), 1973–2004 Long-Term Trend Mathematics Assessments. 21
White/Hispanic Math Gaps: 13 *Significantly different from 2004. 1 White average scale score minus Hispanic average scale score. NOTE: Dashed lines represent extrapolated data. Score gaps are calculated based on differences between unrounded average scale scores. SOURCE: U.S. Department of Education, Institute of Education Sciences, National Center for Education Statistics, National Assessment of Educational Progress (NAEP), 1973–2004 Long-Term Trend Mathematics Assessments. 22
Mathematics—Age 17 ÇAverage scores increased. ÁÂAny change in average scores was not statistically significant. SOURCE: U.S. Department of Education, Institute of Education Sciences, National Center for Education Statistics, National Assessment of Educational Progress (NAEP), 1973–2004 Long-Term Trend Mathematics Assessments. 23
White/Black Math Gaps: 17 *Significantly different from 2004. 1 White average scale score minus Black average scale score. NOTE: Dashed lines represent extrapolated data. Score gaps are calculated based on differences between unrounded average scale scores. SOURCE: U.S. Department of Education, Institute of Education Sciences, National Center for Education Statistics, National Assessment of Educational Progress (NAEP), 1973–2004 Long-Term Trend Mathematics Assessments. 24
White/Hispanic Math Gaps: 17 *Significantly different from 2004. 1 White average scale score minus Hispanic average scale score. NOTE: Dashed lines represent extrapolated data. Score gaps are calculated based on differences between unrounded average scale scores. SOURCE: U.S. Department of Education, Institute of Education Sciences, National Center for Education Statistics, National Assessment of Educational Progress (NAEP), 1973–2004 Long-Term Trend Mathematics Assessments. 25
Students Are Taking More Advanced Mathematics Courses *Significantly different from 2004. 1 “Something else” implies that students checked a series of courses that did not follow a logical course-taking pattern. NOTE: Detail may not sum to totals because of rounding. SOURCE: U.S. Department of Education, Institute of Education Sciences, National Center for Education Statistics, National Assessment of Educational Progress (NAEP), 1978, 1999, and 2004 Long-Term Trend Mathematics Assessments. 26
End slide 27
Participation Rates for Reading LTT LTT: Long-term trend assessment SOURCE: U.S. Department of Education, Institute of Education Sciences, National Center for Education Statistics, National Assessment of Educational Progress (NAEP), 1971–2004 Long-Term Trend Reading Assessments.
Example of an Item with Outdated Material in Original Assessment