Download
1 / 37
370 likes | 456 Vues
Explore diversity initiatives & research activities in electronics & photonics, with faculty, facilities, and opportunities at Purdue ECE College. Understand the importance and challenges of diversity in engineering education. Learn about recruitment efforts and the dual degree program with Bethune-Cookman College. Discover the impact of minority representation in graduate and doctoral degrees. Join the journey towards inclusivity and excellence in the field of engineering.

E N D
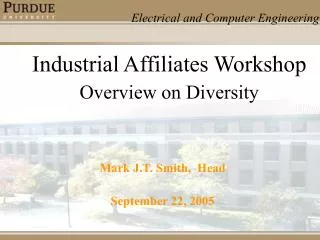
Industrial Affiliates Workshop Overview on Diversity Mark J.T. Smith, Head September 22, 2005
One of the nation’s largest schools: 28% of graduate degrees in Eng College at Purdue 27% of Engineering Baccalaureate degrees in College Ranked in the top 10 ECE graduate programs 85 Faculty About ECE
We Combine Research with Education Units of $1000 This year, expenditures reached $23M
Research Activities Electronics and Photonics Communications and Signal Processing Biomedical Devices and Biomedical Analysis Systems Simulations and Controls Systems Computer Engineering: graphics, compilers, hardware, software, fault tolerant systems Energy Sources and Systems
New Faculty New faculty 2004-05 Xiaojun Lin Minghao Qi Vijay Raghunathan Cordelia Brown Guy Lebanon Dan Jiao Mary Comer Byunghoo Jung Peter Ye Sanjay Rao Chih-Chun Wang New faculty 2003-04 Steve Pekarek Mimi Boutin David Love Vijay Pai Jerry Woodall Babak Ziaie Gene Spafford Elisa Bertino
EPICS • 1500+ Purdue students • S03: 300+ students from • 20 Purdue departments • on 24 teams • 120+ projects deployed
Diversity is a priority for ECE It is one of our strategic goals Why is undergraduate student diversity important?
Engineering education is a journey. Great excitement awaits at the end of the road. • Food and water • Energy • Health • Exploring space • Exploring the oceans • Exploring micro and nano scales • Entertainment
Great opportunities for America’s minority populations. • Issues: • Inclusiveness is critical to our economy • We are challenged by underrepresentation in engineering • We need to get all of America to the highway
Recruitment: We need to our students find the highway. In the words of the great American philosopher … “You got to be very careful if you don't know where you're going, because you might not get there.”
Once you find the highway, you need to say on it. Minority students no longer have the racial and ethnic barriers of the past. In the 1960’s and 70’s, Black students struggled with integration.
We work with the MEP Office MSEE 180 tutoring LSAMP Program Purdue West Lafayette Purdue Calumet IUPUI IU Bloomington Ball State University We have an ECE Tutor Bank
Minority student underrepresentation is more acute at the graduate level.
Minority Doctoral Degrees in S&E • Hispanic Americans 3.25 percent • African Americans 3.19 percent • Native Americans 0.5 percent • Underrepresentation by a factor of four? Sanderson, Allen R., Bernard L. Dugoni, Thomas B. Hoffer, and Sharon L. Myers. (2000) Doctorate Recipients from United States Universities: Summary Report 1999, Survey of Earned Doctorates. Chicago, Illinois: National Opinion Research Center at the University of Chicago. Retrieved July 1, 2004 from www.norc.org/studies/sed/sed9899.pdf.
Minority Doctoral Degrees PhDs in engineering The numbers are small!! 1984 12 African Americans 22 Hispanic Americans 3 Native Americans 1,240 Americans 1999 84 African Americans 71 Hispanic Americans 12 Native Americans 2,474 Amercians Sanderson, Allen R., Bernard L. Dugoni, Thomas B. Hoffer, and Sharon L. Myers. (2000) Doctorate Recipients from United States Universities: Summary Report 1999, Survey of Earned Doctorates. Chicago, Illinois: National Opinion Research Center at the University of Chicago. Retrieved July 1, 2004 from www.norc.org/studies/sed/sed9899.pdf.
Minority Doctoral Degrees PhDs in Physical Sciences The numbers are small!! 1984 35 African Americans 53 Hispanic Americans 7 Native Americans 3,131 Americans 1999 91 African Americans 93 Hispanic Americans 18 Native Americans 3,443 Americans Sanderson, Allen R., Bernard L. Dugoni, Thomas B. Hoffer, and Sharon L. Myers. (2000) Doctorate Recipients from United States Universities: Summary Report 1999, Survey of Earned Doctorates. Chicago, Illinois: National Opinion Research Center at the University of Chicago. Retrieved July 1, 2004 from www.norc.org/studies/sed/sed9899.pdf.
Minority Doctoral Degrees PhDs in Life Sciences The numbers are small!! 1984 75 African Americans 54 Hispanic Americans 12 Native Americans 4,569 Americans 1999 178 African Americans 195 Hispanic Americans 28 Native Americans 5,121 Americans Sanderson, Allen R., Bernard L. Dugoni, Thomas B. Hoffer, and Sharon L. Myers. (2000) Doctorate Recipients from United States Universities: Summary Report 1999, Survey of Earned Doctorates. Chicago, Illinois: National Opinion Research Center at the University of Chicago. Retrieved July 1, 2004 from www.norc.org/studies/sed/sed9899.pdf.
Minority Faculty in S&E On many majority campuses, the percentage of minority faculty is only 1 percent or 2 percent, and many STEM departments throughout the country have no minority faculty at all. Sanderson, Allen R., Bernard L. Dugoni, Thomas B. Hoffer, and Sharon L. Myers. (2000) Doctorate Recipients from United States Universities: Summary Report 1999, Survey of Earned Doctorates. Chicago, Illinois: National Opinion Research Center at the University of Chicago. Retrieved July 1, 2004 from www.norc.org/studies/sed/sed9899.pdf.
Nine-Yr Avg. Enrollment Data 1994-2003 . African American Hispanic American Native American • Aero-Astro 0.33 1.00 0.78 • Ag & Bio 0.22 0.56 0.00 • BioMed 0.11 0.00 0.00 • ChemE 0.44 0.67 0.00 • Civil 2.67 1.67 0.00 • ECE 2.56 1.67 0.00 • IE 1.89 0.00 0.00 • Materials 0.11 0.11 0.00 • ME 1.56 1.00 0.33
Improving Graduate student diversity is a priority for ECE It is one of our strategic goals
Key Elements • Recruitment • Visits to local campuses • Visits to HBCUs and HSIs • Undergraduate summer research programs • Department targets: enroll 3-5 minority PhD students annually • Hire more minority professors
Retention • AGEP professors • AGEP class scholars and peer mentoring • Engagement of student organizations • Departmental monitor of student progress
Future Faculty Preparation • Graduate School’s Preparing Future Faculty program • GEM future faculty workshop • Seminar series