Download
1 / 46
460 likes | 897 Vues
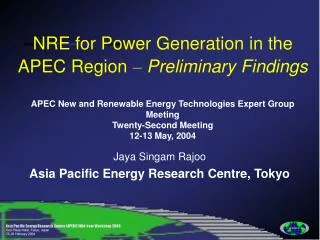
NRE for Power Generation in the APEC Region – Preliminary Findings APEC New and Renewable Energy Technologies Expert Group Meeting Twenty-Second Meeting 12-13 May, 2004. Jaya Singam Rajoo Asia Pacific Energy Research Centre, Tokyo. Outline. Objectives

E N D
NRE for Power Generation in the APEC Region–Preliminary FindingsAPEC New and Renewable Energy Technologies Expert Group Meeting Twenty-Second Meeting 12-13 May, 2004 Jaya Singam Rajoo Asia Pacific Energy Research Centre, Tokyo
Outline • Objectives • Current Status of PV and Wind Technologies for Power Generation • Historical Growth : Wind and PV Technology Demand • Role of NRE in Power Generation • Applications in Niche Market • Policy Measures to Boost NRE Utilisation • Initial Conclusions
Objectives • Identify the role of NRE technologies for power generation in the APEC region • Estimate the NRE resources and potentials in APEC region • Establish the potential applications of NRE in meeting electricity demand in APEC region • Examine policy measures to promote NRE utilisation in APEC power sector
40,000 35,000 30,000 Biomass, wind, solar & others 25,000 Geothermal Hydro TWh 20,000 Oil-Based Nuclear Natural Gas 15,000 Coal Steam 10,000 5,000 0 1999 2005 2010 2015 2020 2025 2030 2035 2040 2045 2050 Current and Projected Status of NRE Technologies for Power Generation in APEC Region Business As Usual (BAU) Scenario NRE’s share-2.38% in 2050
Installed Wind Capacity in Selected APEC Economies USA has 6,374 MW or 82% of the Total APEC Installed Wind Capacity in 2003 1600 7,716.6 1400 Malaysia Indonesia 1200 Chile Chinese Taipei 1000 Mexico Russia Megawatts (MW) 800 3,266.8 Korea New Zealand 600 Japan China 400 Canada Australia 200 1,645.2 0 1993 2000 2003 Source :AWEA
7000 6000 5000 4000 MW 3000 2000 1000 0 1993 1994 1995 1996 1997 1998 1999 2000 2001 2002 2003 Australia Canada China Japan Korea Mexico New Zealand United States Growth Trend: Installed Wind Capacity for Selected APEC Economies Source : AWEA
Growth Trend: Installed Wind Capacity for Selected APEC Economies 1400 1200 1000 800 MW 600 400 200 0 1993 1994 1995 1996 1997 1998 1999 2000 2001 2002 2003 Australia Canada China Japan Korea Mexico New Zealand
35 30 25 20 US cents/kWh 15 10 5 0 1980 1990 1995 2000 2005 2010 Canada USA High Wind Speed Europe High Source : AWEA The cost of wind power in favourable wind regime declined by 47% between 1990 and 2000 and may decline another 38% by 2010
Current Status of Wind Technology • Wind capacity grew 14% annually in APEC and 33% per year globally from 1993-2003 • Highest annual growth in New Zealand with 67% (albeit small base) followed by Japan-54%, Australia-44%, Canada-32% and China-29% • Key issue – how long can this rapid growth continue?
Current Status of Wind Technology • Technical constraint – intermittent resource limits share to 20% of total generation • The best wind resources with lowest generating costs are often distant from load centres. Substantial scale may be needed to allow economical transmission over HV line • Growth concentrated in industrialised economies with favourable policies and economic incentives
Wind Technology Boosters • The US has supported wind R&D for about two decades, in FY2003 it totalled US$43.4 million • Renewable Portfolio Standards - currently in 16 states • Cost reduction of 50% in the last 10 years due to - high growth in demand - fast improving technology - various policy measures and incentives • Other incentives -PTC of 1.5 cents/kWh for first 10 years of operation since 1992 to 2003, extension still pending, rebates up to 50% of cost of small turbine (residential) in California
Wind Technology in Developing Economies • Poorer economies are particularly sensitive to costs and cannot offer financial incentives • May require assistance to map their wind resources – China, Indonesia, Mexico, Philippines and Vietnam had assistance from NREL • In rural areas of developing economies without established power grids, stand-alone wind system are not a practical option • There may be some potential for combined wind/diesel hybrid system in rural applications with favourable wind regime
The US has excellent wind resources within 100 km of major cities like Chicago and Minneapolis Washington N. Dakota Minnesota Montana Oregon Wyoming Iowa Colorado Kansas California Tennessee Texas Source : Montanagreenpower.org
China has excellent wind resources in Anhui, Hubei and Jiangxi Provinces Area covered : 4,000 km2 Good to Excellent Wind at 30 m – 73,500GWh/yr Moderate to excellent – 113,900 GWh/yr Source: NREL
April 1984-1993 January 1984-1993 Measuring Solar Insolation Average annual irradiation on earth – 19 Trillion toe Current annual requirement – 9 Billion toe Source: Earth Observatory, NASA
Average Solar Radiationin USA for July The dots represent the 239 sites of the National Solar Radiation Database (NSRD) Source: NREL Resource Assessment Program
Average Solar Radiationin USA for January The dots represent the 239 sites of the National Solar Radiation Database (NSRD) Source: NREL Resource Assessment Program
Annual Addition to Photovoltaics (PV) Capacity Grew over 4-fold worldwide from 1993-2000 Source: World Energy Council
700 600 500 JPN USA 400 AUS Megawatts (MW) MEX 300 CAN ROK 200 100 0 1992 1993 1994 1995 1996 1997 1998 1999 2000 2001 2002 Installed Photovoltaics (PV) Capacity in APEC Region Installed capacity tripled in Japan from 1999-2003 Source: IEA-PVPS
700 600 500 400 Megawatts (MW) 300 200 100 0 AUS CAN JPN KOR MEX USA Off-grid domestic [MW] Off-grid non-domestic [MW] Grid-connected distributed [MW] Grid-connected centralized [MW] Installed PVCapacity by Applications in Selected APEC Economies, 2002 Rooftop in Japan, mixed uses elsewhere Source: IEA-PVPS
100% 90% 80% 70% 60% 50% 40% 30% 20% 10% 0% AUS CAN JPN KOR MEX USA Off-grid domestic [MW] Off-grid non-domestic [MW] Grid-connected distributed [MW] Grid-connected centralized [MW] Application Share from Total Installed PV Capacity in Selected APEC Economies, 2002 Mostly off-grid applications except in Japan Source: IEA-PVPS
Installed PV Capacity in S.E. Asia, 2002 Still very limited, mostly off-grid application. Focus on rural villages without power grid 6000 5000 4000 Kilowatt (kW) 3000 2000 1000 0 Indonesia Malaysia Vietnam Thailand Philippines Source: ACE
Current Status of PV Technology in APEC Region Major cost reductions have occurred. Further reductions are anticipated as production scale economies are achieved • Annual growth rate of about 33% from 1971-2000 • Total installed capacity still low – around 930MW • Costs are still very high (~ US$0.60 per kWh) but are expected to decline substantially to US$0.30~0.40 by by 2020 • Mostly utilised for off-grid applications (e.g. highway lighting, remote villages) • Distributed rooftop applications – huge in Japan and will be the next major market by reducing balance of system costs by combining PV modules with roof tiles
Current Status of PV Technology in APEC Region • The rooftop market still relies on subsidy for demand stimulation -69 billion Yen from 1994-2000 covering 57,000 residential systems in Japan (210 MW) -16.8 billion Yen from 1992-2000 covering 495 public and commercial facilities (13.5 MW) • Large-scale grid applications will require further sharp cost reduction and intermittent sources like PV would be limited to about 20% of total generation even when cost-effective
Financial Incentives for PV Technology In US the form of subsidy varies according to State Some of the “incentives” offered in California include: a) State rebate programmes – offering $3~4/W for residential installations b) Utility rebate programmes are more generous for both residential and commercial facilities. Rebates ranges from 50% of first panel or $3~5/W for both residential and commercial installations
PV Applications in China • PV systems installed in 600,000 1995-2003 with assistance from GEF • PV production capacity will soon expand from 5 MW to 80MW per year largely directed at export market • Total installed PV capacity should reach 100MW by 2010, 80% for rural electrification • Goal : 24,000 village PV hybrid system by 2004 • Rooftop demonstrated in Beijing and Shenzen
PV Applications in Thailand • Battery charging station – 2 MWp • Telecommunications – 1.5 MWp • Water pumping – 1.13 MWp • Hybrid grid-connected – 313 kWp • Remote schools – 226 kWp • SHS –195 kWp (18,000kW by 2005) • Others – 500 kWp • Future Targets • 300,000 SHS with 120Wp each, to complete by 2006 • 50 MW urban rooftop application by 2011
PV Applications in Indonesia • Total installed capacity – 5 MW • SHS – more than 25,000 unit with capacity of 45 Wp each had been installed • Targets –2,750 new homes to be installed in 2004
PV Applications inPhilippines • Initiated in 1980s under the Philippines-German Solar Energy Programme • Solar Home System (SHS)– around 3,600 system had been installed to date • Total installed capacity – less than 1MW • More than 5 million household unelectrified, great potential for more SHS • Goal – 40,000 to 60,000 SHS by 2006 • Telecommunications – currently 119 systems for relay stations with an installed capacity of 94Wp • Water pumps – 126 systems with a capacity of 175Wp has been installed
PV Applications in Malaysia • SHS – 2.2 MW rural infrastructure • Telecommunications – 73kWp • Water pumping – 10 kWp • Navigation – 2 kWp have been installed so far including lighthouse, maritime beacon • NEDO supported project – 100kW (Diesel hybrid system) to supply rural village in Sabah
Niche Market RURAL ELECTRIFICATION • More than 230 million people in APEC have no access to electricity • Rural population distribution in some economies render grid extension infeasible • PV and wind technology in combination with diesel/battery provide a better alternative in these conditions • Electricity supply have significant impact on rural communities by stimulating economic development and improving quality of life
Niche Market AGRICULTURE • Significant percentage of population is involved in agricultural activities in developing economies of APEC • NRE technologies can be utilised in the agriculture sector - PV and Wind water pumping system - Solar drying
Niche Market OTHER APPLICATIONS • Powering rural schools • Refrigeration of medicine/vaccines in rural health facilities • Communications • Transportation/navigation • Streetlights
Policy Options Demand Pull Strategies Financial Incentives Market Facilitation and Investment Rural Electrification Policy Distributed Generation Policy
Policy Options • Demand Pull Strategies • Renewable Portfolio Standards • Non-Fossil-Fuel-Obligation (UK, 1990-1997) • Feed-in Tariffs (resulted in 8,500MW of installed wind from 1991-2001 in Germany) • Green certificate (US, Australia, UK, Denmark & Belgium)
Policy Options • Financial incentives • Subsidies and rebates (Sunshine Programme -Japan, “Million solar roofs”- US) • Tax relief (Investment tax credits, accelerated depreciation, production tax credits, property tax incentives, personal income tax incentives, sales tax incentives, pollution tax exemptions, etc) • Grants • Loans (varies in amount – residential, commercial and industrial)
Policy Options • Market facilitation and investment • Carbon tax, System Benefits Charge • NRE access laws (allows property owners to access NRE resources) • Infrastructure policy • Government procurement • Public awareness programme
Policy Options • Rural Electrification Policy • Energy Service Concession • Microcredit and Rural Business Development • Line extension Analyses
Policy Options • Distributed Generation Policies • Real-time pricing • Net metering • Interconnection Regulation
40,000 35,000 30,000 Biomass, wind, solar & others 25,000 Geothermal Hydro TWh 20,000 Oil-Based Nuclear Natural Gas 15,000 Coal Steam 10,000 5,000 0 1999 2005 2010 2015 2020 2025 2030 2035 2040 2045 2050 APEC Power Generation, 1999-2050 An illustration based on 10% RPS in APEC NRE - 4.7%
Assumptions • Only in economies with GDP/capita of US$10,000 or more by 2030 • 10% increase – with 2.5% for every 5 years starting from 2035 • Hydro is excluded • Excluding existing share of non-hydro NRE in 2034
40,000 35,000 Geothermal 30,000 Hydro 25,000 Natural Gas TWh 20,000 Nuclear 15,000 Oil-Based 10,000 Coal Steam 5,000 Biomass, wind & solar 0 2000 2010 2020 2030 2040 2050 APEC Power Generation by Fuel Share An illustration based on 10% RPS in APEC Source: APERC 2004
400 350 300 250 N. Gas 200 MT Oil 150 Coal 100 50 0 2035 2040 2045 2050 Source:APERC 2004 Avoided Annual CO2 Emission An illustration based on 10% RPS in APEC 20 182 357
2035 2040 2045 2050 Coal (tonnes) 27.87 61.15 97.15 133.47 Oil (mil bbls) 4.38 16.98 30.48 44.48 Gas (BCM) 15.17 33.91 54.15 74.56 Annual Total Fuel Saved with 10% RPS An illustration based on 10% RPS in APEC Source: APERC 2004
Preliminary Conclusions • Non-hydro NRE would have a modest impact on the overall electricity industry • Current growth in NRE is dependent on favourable state “incentives” in the short term • Sound policy measures and economic incentives are vital for deployment of emerging technologies such as PV
Preliminary Conclusions • Difficult to duplicate in developing economies without support from developed economies • In most cases, NRE took off only with initial bilateral/international financial support