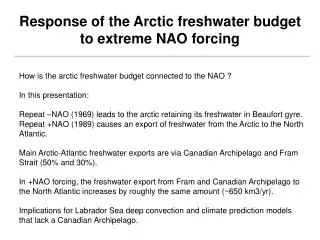
The Arctic Oscillation and the relation to the extreme summer heat wave of 2010
200 likes | 406 Vues
The Arctic Oscillation and the relation to the extreme summer heat wave of 2010. ATMS790: Graduate Seminar, Yuta Tomii. Reference: Otomi, Y., Tachibana, Y. & Nakamura, T. Clim Dyn (2013) 40: 1939. https://doi.org/10.1007/s00382-012-1386-0. Outline. Motivation What is Arctic Oscillation?

The Arctic Oscillation and the relation to the extreme summer heat wave of 2010
E N D
Presentation Transcript
The Arctic Oscillationand the relation to the extreme summer heat wave of 2010 ATMS790: Graduate Seminar, Yuta Tomii Reference:Otomi, Y., Tachibana, Y. & Nakamura, T. Clim Dyn (2013) 40: 1939. https://doi.org/10.1007/s00382-012-1386-0
Outline Motivation What is Arctic Oscillation? The Relationship with Jet Streams Summary of the Paper Main results of the paper Conclusion
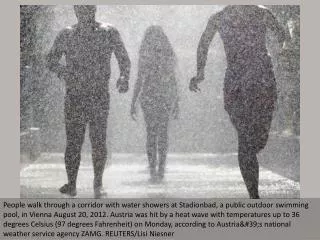
Motivation • 1. In summer of 2010, Europe and western Russia experienced record-breaking hot temperatures, attributed to ablocking high pressure over the Europe and Russian region. • 2. Northern and eastern part of Japan experienced the highest summer mean temperature in the history. • 3. Some researchers predicted the temperature would be below average in summer of 2010: Eyjafjallajökull eruption in Iceland from March to June in 2010 .
Motivation: heat wave in Japan Mean precipitation(℃) and temperature (%) deviation(June to August in 2010)
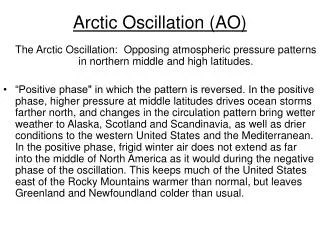
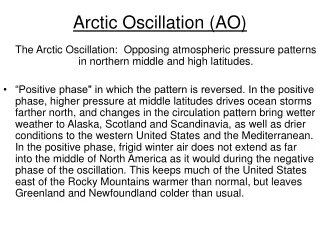
Phigh_lat_anomaly What is the Arctic Oscillation:AO? • Pmid_lat_anomaly • It is a teleconnection: change in systematicpressure difference between high and middle latitudes • Definition: A non-periodic variation in surface atmospheric pressure in the Arctic region coupled with an opposite variation in the middle latitude (and associated with similar variation in the North Atlantic)
What is the Arctic Oscillation:AO? Phigh_lat_anomaly AO index: indicator for its state and strength Positive(+); When Pmid_lat_anomalyis positive and Phigh_lat_anomalyis negative 2. Negative(-); When Phigh_lat_anomalyis positive and Pmid_lat_anomalyis negative • Pmid_lat_anomaly
What is the Arctic Oscillation:AO? AO Positive : When mass of air column at mid-latitudeis greater and mass of air column at high latitudeis smaller Mass of Air Column at High Latitude Mass of Air Column at Middle Latitude
What is the Arctic Oscillation:AO? low pressure anomaly in the Arctic region and high press anomaly in mid latitude low and high pressure anomalies are associated with low and high temp anomalies at each location because of compression and expansion. AO index? • Time-mean temp (850mb) • Time-mean geopotential height (300mb)
Relationship with Jet Streams Negative Phase Positive Phase Positive phase: warm in the middle latitude Negative phase: cold in the middle latitude
Summary of the paper In 2010, Northern hemisphere: Eastern Europe, and Japan experienced an abnormally hot summer associated with positive AO index. There was a drastic change in the index from the previous winter to summer: from negative index to positive index. The change of the AO index might have been related to the large heat capacity of the Atlantic ocean.
From July to Aug, extremely positive AO index exists: (blue curve). It coincides with hot days in mid-latitude: (red curve). Although they do not coincide in spring, the index in summer and winter corresponds well.
a. Time-mean 300mb layer b. Time-mean temp on 850mb • In figure a, positive geopotential anomaly is in middle latitude and negative anomaly in the Arctic region • We can see the height contours meandering and suggesting an existence of blocking-high over Europe • In figure b, high temp anomaly is over eastern Europe and Russia and low temp anomaly in the Arctic region and Siberia
mean 1000mb map mean 500mb map In figure a and b, positive geopotential anomalyis in the high latitude (Arctic region ) and negative anomaly in the middle latitude. In figure c, there isa high temperature anomaly in Northern Atlantic, low anomaly in the middle region and high anomaly in the tropic region. The pattern corresponds to the typical negative Northern Atlantic Oscillation (NAO), which is called tripolar pattern. The author claims that negative AO index is correlated to the negative NAO index because of the fact. mean temp on 850mb
Typical Negative NAO index Structure We can see the tripolar pattern in SST: warm anomaly in high latitude and tropic, and cold anomaly in middle latitude of Northern Atlantic. Latent and sensible heat flux corresponds to the tripolar pattern.
Latent and sensible heat flux deviates from the tripolar pattern from May. However, the SST anomaly still shows the tripolar pattern. The author claims thatthis is because of the large heat capacity of the Atlantic Ocean.
In figure a, diabatic heating anomaly in the Atlantic Ocean is calculated and it corresponds to the SST anomaly in July and August. The author points out that the Atlantic Ocean heats the atmosphere. In the same way, the author calculates the heating anomaly in Eurasian and African continent in figure b.
Wind response to the heating anomaly on 300mb in the Atlantic Ocean Geopotential height response to the diabatic heating anomaly on 300mb In figure a, the diabatic heating anomaly causes the double jet structure which Ogi et al found is corresponding to the positive AO index. Figure c shows that the diabatic heating in the Atlantic Ocean causes high pressure over Europe, which resulted in record breaking hot temperature in Europe.
Conclusion A negative AO (and NAO) index causes warm SST anomalies in high latitude and tropic regions of the Atlantic. Because of the AO (and NAO) structure, the ocean receives the heat over the high latitude and the tropic regions. Due to the large heat capacity of the ocean, the warm SST anomaly structure did not change in summer, heating the atmosphere, which can be seen in the diabatic heating map. As a result, the SST anomaly structure causes high pressure in Europe.
http://www.cpc.ncep.noaa.gov/products/precip/CWlink/daily_ao_index/ao_index.htmlhttp://www.cpc.ncep.noaa.gov/products/precip/CWlink/daily_ao_index/ao_index.html