Download
1 / 1
10 likes | 146 Vues
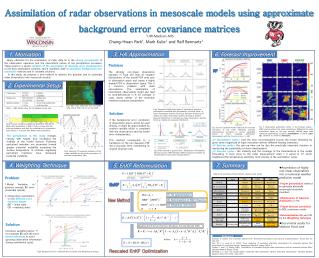
A Statistical Assessment of Mesoscale Model Output using Computed Radiances and GOES Observations. 4(a). 4(b). 5(a). 5(b). 4(c). 1(a). 1(b). 1(c). 2(a). 2(b). 2(c). Manajit Sengupta 1 , Louie Grasso 1 , Daniel Lindsey 2 and Mark DeMaria 2

E N D
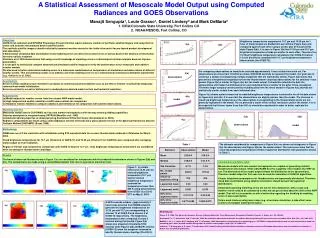
A Statistical Assessment of Mesoscale Model Output using Computed Radiances and GOES Observations 4(a) 4(b) 5(a) 5(b) 4(c) 1(a) 1(b) 1(c) 2(a) 2(b) 2(c) • Manajit Sengupta1, Louie Grasso1, Daniel Lindsey2 and Mark DeMaria2 • CIRA/Colorado State University, Fort Collins CO • NOAA/NESDIS, Fort Collins, CO Objectives GOES-R risk reduction and NPOESS Preparatory Project activities require advance creation of synthetic satellite imagery and using them to create and evaluate new products before satellite launch. The synthetic satellite imagery should realistically represent weather events for the fields to be useful for pre-launch product development and assessment. 4-dimensional variational data assimilation treats modeling errors as either non-existent or on an ad hoc basis in the absence of information for more realistic treatment. Vukicevic et al. 2005 demonstrates that using current knowledge of modeling errors in 4-dimensional variation analysis does not improve assimilation. It is our goal to statistically compare observed and simulated satellite imagery to verify the performance of our mesoscale and radiative transfer models. We also seek to better understand modeling errors in a mesoscale model based on comparisons of simulations and observations of different weather events. This will ultimately enable us to address and treat modeling errors in our 4-dimensional variational assimilation experiments (e.g. Vukicevic et al. 2005). Brightness temperatures computed at 10.7 µm and 10.35 µmfor 1 hour of model output are divided into percentiles (Figure 3(a)) and compared against each other using a scatter plot of the percentile data (Figure 3(b)). It is seen in Figure 3(b) that 10.35 µmand10.7 µmbrightness temperatures fields are similar to each other.Therefore the 10.35 µmbrightness temperature calculations (for GOES-R channel 13) can directly be compared with 10.7 µmbrightness temperatureobservations (for GOES-12). 3(a) 3(b) For comparing observations to models we selected approximately 1 hour of data from each set. For observations we chose hour 23 while we chose 3000-6000 seconds to represent the model. Our goal was to construct a sample encompassing multiple snapshots that are statistically similar. Figure 4(a) shows that percentiles of brightness temperatures from the thunderstorm cloud top observations for the selected 1 hour period. Figure 4(b) is similar to Figure 4(a) but for model output. It should be noted that in both the observations and model the distribution for each individual time is similar to the other times considered. Therefore larger samples constructed by including data from the times shown in Figures 4(a) and 4(b) are statistically similar to data from each individual time. Figure 4(c) shows a plot of observed to modeled brightness temperatures in percentile for all the data shown in Figure 4(a) and 4(b). It is seen that the observations are slightly warmer than the model. The increase in cloud top brightness temperature in the observations corresponding to the thunderstorm anvils are not perfectly replicated in the model. This is primarily a result of the vertical resolution used in the model. It is to be expected that thinner layers (less than 500 m) should be considered in order to better replicate the observations. observations Assumptions Errors in initial conditions have minimal to no impact on numerical weather prediction runs as our time of interest is sufficiently temporally removed from model initialization. Errors are primarily a result of deficiencies in model physics and and model vertical and horizontal resolution. Requirements (a) Model outputs for weather events from the relevant NWP model model. (b) High temporal and spatial resolution satellite observations for comparison. (c) Radiative transfer models to compute radiances and reflectance for comparison with satellite observations. model Modeling specifics Mesoscale model used is CSU-RAMS as it has two moment microphysics with two way nested g ridding capabilities. Gaseous absorption is computed using OPTRAN (Mcmillin et al. 1995). Condensate optical properties is computed using Anomalous Diffraction theory (Greenwald et al. 2002). Radiance computations are made using a delta-eddington scheme (infrared) and a plane parallel version of the Spherical Harmonics Discrete Ordinate Method (SHDOMPP) (Evans 1998). observations model Methodology RAMS was run at 2 km resolution with initialization using ETA reanalysis data for a severe thunderstorm outbreak in Oklahoma for May 8, 2003. Cloud brightness temperatures for 10.7 m(Channel 4 of GOES-12) and10.35 m (Channel 13 of GOES-R) were computed after averaging model output to 4 km resolution. Region of interest was extracted for comparison with GOES-12 data for 10.7 m . Only brightness temperatures below 243 K are considered while screening for thunderstorm cloud tops. Table 1 The datasets considered for comparison in Figure 4(c) are shown as histograms in Figure 5(a) for observations and Figure 5(b) for the model output. The red curves show that the cloud top brightness temperatures follow a lognormal distribution with parameters shown in Table 1. Results The band of observed thunderstorms in Figure 1(c) are considered for comparison with the modeled thunderstorm shown in Figures 2(b) and 2(c). The comparisons are made using a consolidated dataset that covers a period of around an hour. Conclusions and future work Mesoscale models with two moment microphysics are capable of generating realistic thunderstorm simulations. While CSU-RAMS has this capability other models like WRF do not. The distribution of the model output follows the distribution of the observations. Therefore model output for this case can be used for evaluation of GOES-R algorithms. Clouds brightness temperatures for thunderstorms are lognormally distributed. Therefore cloud data assimilation using satellite information should account for lognormal distributions. Statistically speaking modeling errors are low for this comparison. Other cases and weather events need to be considered so that we can get an idea about the skill of this NWP model. That will in turn provide us with a better idea regarding the handling of modeling errors in data assimilation. Future work involves using more cases (e.g. a hurricane simulation, a lake effect snow event) to investigate model performance. Figure 1: (a) visible reflectance (0.65 m) (b) infrared brightness temperature (10.7 m) and (c) infrared brightness temperature screened for temperatures lower than 243 K using observations from GOES 12 at 23:45 UTC on May 8, 2003. A 6000 seconds window (approximately 2 hours) was selected from RAMS output to generate the brightness temperatures for 10.35 m and 10.7mcorresponding to channel 13 of GOES-R and channel 4 of GOES-12 respectively. The brightness temperatures were computed at every 5 minutes during that period. Figure 2(a) shows one snapshot (timestamp 5700 second) while Figures 2(b) (GOES-R) and 2(c) (GOES-12) show the snapshot screened to identify thunderstorm cloud top (Tb<243 K). 2(b) 2(a) References: Evans, K. F., 1998: The Spherical Harmonics Discrete Ordinate Method for Three-Dimensional Atmospheric Radiative Transfer, J. Atmos. Sci., 55, 429-446. Greenwald, T. J., R. Hertenstein, and T. Vukicevic, 2002: An all-weather observational operator for radiance data assimilation with mesoscale forecast models. Mon. Wea. Rev., 130, 1882-1897. McMillin, L. M., L. J. Crone, M. D. Goldberg, and T. J. Kleespies, 1995: Atmospheric transmittance of an absorbing gas, 4. OPTRAN: A computationally fast and accurate transmittance model for absorbing gases with fixed and variable mixing ratios at variable viewing angles, Appl. Opt., 34, 6269-6274. Vukicevic, T., M. Sengupta, A. S. Jones, T. Vonder Haar, 2005: Cloud Resolving Satellite Data Assimilation: Information content of IR window observations and uncertainties in estimation; J. Atmos. Sci, accepted for publication.