Download
1 / 28
280 likes | 417 Vues
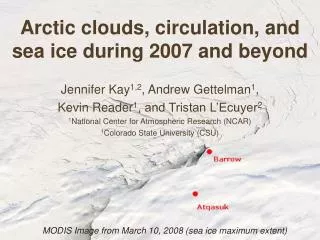
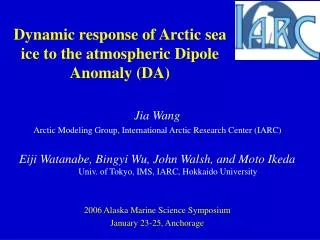
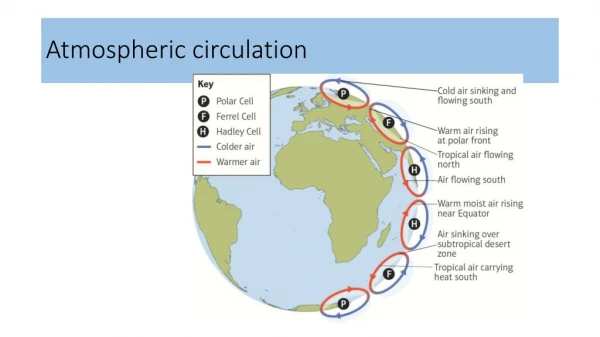
Atmospheric Circulation Response to Future Arctic Sea Ice Loss. Clara Deser, Michael Alexander and Robert Tomas. Future Arctic Sea Ice Loss NCAR Coupled Model Simulation Holland et al. (2006). September Sea Ice Extent. Ice Extent (10 6 km 2 ). Model drop 1.8 million sq km, 2024–2025

E N D
Atmospheric Circulation Response to Future Arctic Sea Ice Loss Clara Deser, Michael Alexander and Robert Tomas
Future Arctic Sea Ice LossNCAR Coupled Model SimulationHolland et al. (2006) September Sea Ice Extent Ice Extent (106 km2) Model drop1.8 million sq km, 2024–2025 Observed drop1.6 million sq km, 2006–2007 NCAR CCSM3 model simulation Observations Figure courtesy of Julienne Stroeve
Future Arctic Sea Ice LossNCAR Coupled Model SimulationHolland et al. (2006) September Sea Ice Extent Ice Extent (106 km2) Model drop1.8 million sq km, 2024–2025 Observed drop1.6 million sq km, 2006–2007 NCAR CCSM3 model simulation Observations 1980-99 2080-99 ~ 2xCO2 Figure courtesy of Julienne Stroeve
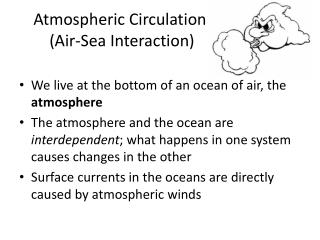
CCSM3 Arctic Sea Ice Concentration 1980-99 2080-99 (A1B) September (%) March
ApproachPrescribe sea ice cover for 1980-99 and 2080-99to Community Atmospheric Model Version 3 T85 (1.4° latitude x 1.4° longitude); 26 levels DETAILS • 60 year integrations with repeating seasonal cycle of time-average sea ice concentration and thickness: • 1980-99 (CCSM3 historical) • 2080-99 (CCSM3 A1B) • SSTs fixed at 1980-99 values, and set to -1.8 C where sea ice removed
Sea Ice Change: 2080-99 minus 1980-99 Sea Ice (%) Sea Ice (%) Ice loss Ice gain p_12months_ice_pres_fut.gif
Sea Ice Change: 2080-99 minus 1980-99 Sea Ice (%) Sea Ice (%) Ice loss Ice gain p_12months_ice_pres_fut.gif
Surface Energy Flux Response (Wm-2) Sea Ice Energy Flux Sea Ice Energy Flux p_12months_ice_pres_fut.gif Positive upward
Air Temperature Response (°C) Sea Ice Air T 15-20°C Sea Ice Air T p_12months_ice_pres_fut.gif
Air Temperature Response (°C): Land Only Sea Ice Air T 2-5°C Sea Ice Air T p_12months_ice_pres_fut.gif
Snow Depth Response (cm liquid water equivalent) Air T Snow Air T Snow p_12months_ice_pres_fut.gif
Sea Level Pressure Response (hPa) ci=1hPa Sea Ice SLP shading = 95% significant Sea Ice SLP p_12months_ice_pres_fut.gif
Sea Level Pressure Response (hPa) ci=1hPa Sea Ice SLP shading = significant Sea Ice SLP p_12months_ice_pres_fut.gif
How does the atmospheric circulation response to Arctic sea ice loss compare with the response to doubled CO2 in the fully coupled CCSM3?
Sea Level Pressure Response (hPa) ci=1hPa CAM3 CCSM3 CAM3 CCSM3 p_12months_slp_ccsm3_cam.gif
Sea Level Pressure Response (hPa) ci=1hPa Atm Model Coupled Model Atm Model Coupled Model p_12months_slp_ccsm3_cam.gif
SUMMARYAtmospheric Circulation Response to Future Arctic Sea Ice Loss • Largest sea ice loss in summer-fall (July-Nov), but largest surface energy flux response (which forces the atmosphere) in fall-winter (Oct-Mar) • Thermodynamic response: warming (and moistening) of the boundary layer especially in fall-winter (2-5K over land and 15-20K over the Arctic ocean); increased snow cover over Siberia and northern Alaska • Dynamic response: SLP response largest in fall-winter when it accounts for some of the response to 2xCO2 in the coupled model; negligible in summer
Next StepsAtmospheric Circulation Response to Future Arctic Sea Ice Loss • Allow sea surface temperatures to respond to sea ice loss • Similar experiments with a regional high resolution atmospheric model (Cassano et al.) and an AGCM with a resolved stratosphere • Similar experiments for snow cover (Tomas et al.)
Precipitation Response (mm day-1) Sea Ice Precip & SLP Sea Ice Precip & SLP p_12months_ice_slp_precp.gif
Sea Ice Concentration (%) 1980-99 2080-99 1980-99 2080-99 p_12months_ice_pres_fut.gif
Summer 2007 Arctic Sea Ice Loss September 2007 sea ice (white area) vs. September long term mean (pink line)
2080-99 minus 1980-99 Surface Energy Flux (Wm-2) SLP (hPa) Surface Energy Flux (Wm-2) SLP (hPa) Ci = 1hPa; Shading sig p_12months_ice_pres_fut.gif
Surface Energy Flux Response (Wm-2) Radiative (LW) Turbulent (SH+LH) Radiative (LW) Turbulent (SH+LH) p_12months_ice_pres_fut.gif