Download

1 / 22
220 likes | 380 Vues
Simulated and Observed Arctic Sea Ice loss. The models exhibit an enormous degree of spread, and generally undersimulate the observed sea ice loss over the past few decades. . ( Stroeve et al. 2007). A word about the simulations examined here:

E N D
Simulated and Observed Arctic Sea Ice loss The models exhibit an enormous degree of spread, and generally undersimulate the observed sea ice loss over the past few decades. (Stroeveet al. 2007)
A word about the simulations examined here: The IPCC AR4 models are forced by the SRESA1B scenario, for which the CO2 concentration stabilizes at 720 ppm in 2100. The period used to compute the climatological anomalies is 2150-2199. Reference climatological means are computed over the 1900-1949 period.
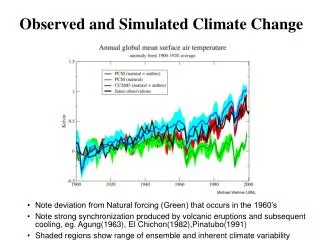
Zonal–mean warming in current climate models by the end of the 22nd centuryLines are ensemble means, brackets denote intermodel spread, as measured by +/- one standard deviation . The “polar amplification” seen in the surface air temperature increase is not seen in the ocean heat content increase. Upper ocean heat content Surface air temperature
Surface Air Temperature Increase The ensemble- mean surface air temperature increase is greatest in fall and winter, when thinning sea ice leads to larger heat transfer from the ocean to the atmosphere. In this sense, the surface warming can be seen as a passive response to thinning sea ice, rather than the most representative feature of a warming climate.
Change in Energy Budget at Top of Atmosphere Longwave feedbacks play a large role in Arctic climate change, and dominate in fall and winter.
Integrated Upper Oceanic Temperature and Heat Content The heat content increase is greatest in summer, the time of year when positive feedbacks are greatest.
Why do feedback analysis? If we can construct a feedback framework that is predictive of the climate models’ response, we can understand what processes cause intermodel spread. To the extent these processes are clearly linked to model error, this is a path towards eliminating model biases and reducing model spread.
Definition of feedback parameters… …must instead take into account the peculiarities of Arctic climate change. We define the climate sensitivity in terms of upper ocean heat content, ΔTOC, and fluxes are averaged over the Arctic region.
Predictive skill of Arctic-specific Regionally-defined radiative feedbacks based on ∆Toc account for the spread in the Arctic’s quasi-equilibrium climate response to external forcing. The remaining spread is likely due to variations in heat transport into the Arctic. warming (K) (Boé et al. 2009a)
Negative longwave feedback, which has greatest strength in winter, is primarily responsible for the spread in warming. Though shortwave feedbacks are positive in all models, they exhibit less intermodel variability, and are generally smaller in magnitude than their longwave counterparts. Surprisingly, almost all the intermodel variation in the longwave feedback arises from the clear-sky component (not shown). warming (K) (Boé et al. 2009a)
Inversion Strength and Climate response The climatological strength of the winter atmospheric temperature inversion controls longwave feedback, and climate response warming (K) The greater the winter inversion strength, the larger the near-surface temperature increase for the same increase in surface fluxes through thinning sea ice. This results in a larger emission of longwave radiation to space. The large loss of energy in winter means less overall warming on an annual-mean basis winter inversion strength (diff between T at 850 hPa and surface) (Boé et al. 2009a)
Strong Damping Weak Damping Dry Atmosphere Dry Atmosphere Weak Inversion, Small Warming Strong Inversion, Large Warming Thinning Ice Thinning Ice Warming Ocean Warming Ocean STRONG INVERSION CASE WEAK INVERSION CASE
Inversion Strength and Climate response Climatological inversion strength may be too large in many models, leading to unrealistically large negative longwavefeedback. The relatively low inversion strength in the reanalyses can be confirmed by satellite measurements. (Pavelsky et al. 2009) NCEP reanalysis warming (K) ERA40 reanalysis (Boé et al. 2009a) winter inversion strength (diff between T at 850 hPa and surface)
Simulated and Observed Arctic Sea Ice loss The models generally undersimulate the observed sea ice loss over the past few decades. (Stroeveet al. 2007)
(Boé et al. 2009b) Variance in change in sea ice cover explained by percentage of total ice cover whose thickness is less than 0.5m in the 1950-1979 period. Models with large initial coverage of thin ice have larger decreases in ice extent as the climate warms. Intermodel variations in sea ice cover loss are well-correlated with late 20th century variations in the climatological extent of thin ice. This is particularly true early in the 21st century.
(Boé et al. 2009b) However, by the late 21st century and into the 22nd century, the sea ice loss is controlled mostly by the Arctic’s radiative feedbacks. Throughout the 21st century, the intermodel variability in Arctic ice loss can be explained by just two factors, both of which may be constrained.
Conclusions The strength of snow albedo feedback may be constrained through measurements of this feedback in the context of the present-day seasonal cycle. Intermodel variation in Arctic climate response is controlled mainly by the strength of the wintertime temperature inversion. The temperature inversion is unrealistically strong in most models, indicating the models generally have excessive negative longwave feedback.Initial ice thickness distribution is the main control on sea ice loss for the first half of the 21st century. Subsequently, the Arctic climate feedback parameter is the main control on ice loss. To the extent the simulated response to climate change can be related to observable aspects of the current climate, model validation should focus on those aspects.
If we use the conventional ΔTa to define λ, we end up with a feedback parameter that is not predictive of Arctic climate change
The Arctic Ocean area is not nearly as stratified in wintertime as the surrounding permafrost-covered land areas. The inversion strength is closely linked to sea ice concentration, being stronger where sea ice concentration is higher. Mean DJF AIRS inversion strength from December 2002- February 2008, with mean DJF inversion strength from radiosondes over the same period superimposed. (Pavelsky et al. 2009)