Download
1 / 27
280 likes | 445 Vues
Arctic Sea Ice, Arctic Vegetation Change and Lessons from 2007. D.A. (Skip) Walker University of Alaska Fairbanks. Collaborators. Uma Bhatt, Gary Kofinas, Martha Raynolds, Vladimir Romanovsky, Skip Walker: University of Alaska Fairbanks Joey Comiso: NASA Goddard

E N D
Arctic Sea Ice, Arctic Vegetation Change and Lessons from 2007 D.A. (Skip) Walker University of Alaska Fairbanks
Collaborators Uma Bhatt, Gary Kofinas, Martha Raynolds, Vladimir Romanovsky, Skip Walker: University of Alaska Fairbanks Joey Comiso: NASA Goddard Howie Epstein: University of Virginia Jiong Jia: REC-TEA, Chinese Academy of Science Marina Liebman, Nataliya Moskalenko: Earth Cryosphere Laboratory, Moscow, Russia Bruce Forbes: Arctic Centre, Rovaniemi, Finland Funding NSF: Synthesis of Arctic System Science initiative NASA: Land Cover Land-Use Change program
Is the trend in sea-ice affecting Arctic vegetation ? Since 1980, perennial sea ice extent in the Arctic has declined at the rate of 10.1% per decade, and area trend is -11.4% decade (Comiso et al. 2008, Geophysical Research Letters 35: L01703). 2007!
Outline • Connection between sea ice, summer land temperatures, arctic tundra greening and climate. • Need for circumpolar terrestrial baseline representing entire bioclimate gradient. • Special need for baseline in the perennial ice zones.
Although there is no direct link between sea ice and vegetation… Climate Land Surface Temperature Summer warmth index Precipitation Terrain Soil Bedrock Topography Vegetation Structure Composition NDVI Biomass Sea Ice Distribution Longevity **** Human and wildlife land use Forage availability Desertification, grassification, shrubification Firewood availability
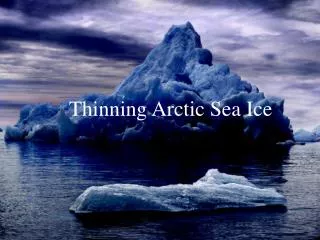
…the Arctic tundra is a maritime biome, that is largely defined by its proximity to sea ice. • 80% of lowland tundra areas are is within 100 km of at least seasonally frozen oceans. • Changes in the Arctic ocean sea ice will very likely affect terrestrial ecosystems. • Walker, D. A., 2005. The Circumpolar Arctic Vegetation Map. Journal of Vegetation Science.
Best evidence of widespread change comes from satellites using an index of greenness. Reflectance spectra of common ground-cover types Green vegetation has the unique property of absorbing strongly in the visible (particularly red light) portion of the spectrum and reflecting strongly in the near infra-red portion. The greater the difference between the reflectance in the R and NIR portions of the spectrum the more chlorophyll is in the vegetation canopy. 1 2 3 2 1 3 NDVI = (NIR-R) / (NIR+R) From Lillisand and Kiefer 1987
The spring season has started earlier and max NDVI has increased. • NDVI trends for the forested and tundra regions, broken down by six-year intervals. • The forested areas show a recent decline in the maximum Pg. • Tundra regions have shown a continued increase in Pg and a marked 10-day shift toward earlier onset of greening. • There is no corresponding shift in the cessation of the greening period. 10% increase in NDVI 10-day spring shift in growing season length Goetz et al. 2005. PNAS,102: 13521-13525
Numerous studies have shown a general trend of increased NDVI in the Arctic, but… “Should we believe in the NDVI trend? There are no “ground truth” measurements of photosynthesis at northern high latitudes over the same period, and so the accuracy of the trend cannot be established unambiguously.” (Inez Fung, 1997)˘ Bunn et al. 2007, Eos, 88: 333-334.
Great need for consistent Arctic-wide ground biomass data • Links to satellite information. • Time series at intensive research sites to document change.
Analysis of sea-ice, land surface temperature and NDVI trends: Arctic seas and associated land masses Division of Arctic Ocean and associated land masses according to Russian Arctic Atlas
Pan-Arctic Regional Variability • Summer warmth index (SWI) • Mid July Sea Ice percentage cover • Max NDVI • Integrated NDVI Bhatt, Walker, Raynolds, Comiso, In prep.
Sea-ice and temperature trends in Beaufort Sea and Kara/Yamal region of Russia Beaufort Negative sea-ice trend correlated with positive temperature trend Kara/Yamal Negative sea-ice trend but nearly flat temperature trend
NDVI trends in Beaufort Sea and Kara/Yamal region of Russia Beaufort Kara/Yamal • Much lower NDVI on the Yamal is likely due to sandy wind-blown nutrient-poor soils, and grazing by reindeer. • Greater change in Beaufort Region (+0.04 vs. +0.0085 NDVI units/decade) most likely due to more positive trend in ground surface temperatures in the Beaufort region during the period of record (Bhatt et al. 2007). • Recent years missing because of missing and poor NDVI data north of 70˚.
General trends • Year to year variation in summer land surface temperature (SWI) is strongly correlated with mid-July ice cover within 50-km of the coast. • Maximum and integrated NDVI are strongly correlated with the trend in SWI, but not to yearly variation in sea-ice.
General trends • The positive phase of NAO or AO is consistent with a warmer winter Arctic, reduced summer sea ice (-), increased SWI (+) and increased integrated NDVI (+). • Strongest climate-driver for sea ice and NDVI correlations are in the Laptev and East Siberian seas. • Correlations require more thought in terms of mechanisms.Analysis of wind correlations with NDVI and SWI are in progress.
Circumpolar pattern of NDVI • Primary controls at pan-Arctic scale: • Summer temp • Lake cover • Soil type • Glacial history Raynolds et al. 2006, Remote Sensing of the the Environment
Summer land-surface temperature as shown by the summer warmth index(SWI) Subzone E D C B A Area (km^2 x 100) Summer Warm Index (SWI, ˚C mo) SWI derived from 20-yr mean AVHRR thermal data (Raynolds et al. 2008 Rem. Sens. Envir.)
Arctic bioclimate subzones 5 subzones spaced atapproximately 2˚C mean July temperature intervals. Bioclimate Area SubzoneMean July Temp (km2 x 106) A 1-3˚ C .114 (2%) B 3-5˚ C .450 (6%) C 5-7˚ C 1.179 (17%) D 7-9˚ C 1.564 (22%) E 9-12˚C 1.840 (26%) Glaciers 1.975 (28%) Total Arctic 7.111 (100%) Subzone A is a rare subzone. Stature of woody plants is a primary factor that characterizes vegetation in the subzones. A No woody species B Prostrate dwarf shrubs, <5 cm tall C Hemi-prostrate dwarf shrubs, 5-15 cm D Erect dwarf shrubs, 15-40 cm E Low shrubs, >40 cm
Subzone A is characterized by:Very cold summers (Mean July tempeature <3˚ C). Extremely small vascular-plant flora (about 60 species for the entire subzone).No sedges.No woody plants.No peat deposits Isachsen, Nunuvut, Canada Isachsen, Ellef Ringnes Island
In the Russian literature, subzone A is treated as an entirely separate bioclimate “Zone” -- the true “polar desert” of Gorodkov, Alexandrova and others.Also called the “poppy zone” because of the dominance of Papaver polaris on many landscapes. • If the Tundra Zone is defined by its proximity to the Arctic Ocean, subzone A is defined by its proximity to perennial sea ice. Isachsen, Nunuvut, Canada
Subzone A: cold endpoint along the summer bioclimate gradient that is very poorly studied because of the lack of biological stations in this subzone
Northern-most site in 2002-2006 Biocomplexity of Patterned Ground studies
Ground and satellite observations along the complete Arctic bioclimate gradient: 2 transects North America Yamal Russia
Lessons from 2007:Recognition that Bioclimate Subzone A is in the region of heaviest multiyear ice along the western Canadian Archipelago, N. Svalbard and Arctic Russian Islands.If summer arctic ice vanishes, so does Subzone A.Subzone A is a rare and endangered bioclimate subzone! Nghiem et al. 2008.
Summary • Critical need for baseline studies in Subzone A and B (Isachsen and Mould Bay). • Will require close coordination with Canadians (Arctic Net) and inclusion of other terrestrial monitoring programs, including CBMP, CALM, TSP and flagship observatories (Toolik, Barrow, Zachenburg, etc.), as well as ocean and sea ice studies. • Step in developing standardized protocols at a network of sites for a coordinated Circumpolar Terrestrial Ecosystem Baseline along the complete arctic bioclimate gradient.