Download
1 / 59
590 likes | 736 Vues
Interactions between actors involved in planning and design decision processes Prof.dr.ir. B. de Vries. Actor roles. Actors = Researcher + City Actors = Pedestrian + City Actors = Designer + City. Interactions between Researcher and City. B. de Vries A. Tan. Research Project.

E N D
Interactions between actors involved in planning and design decision processesProf.dr.ir. B. de Vries
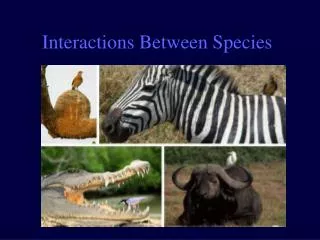
Actor roles • Actors = Researcher + City • Actors = Pedestrian + City • Actors = Designer + City
Interactions between Researcher and City B. de Vries A. Tan
Research Project • To assess the reliability and validity of interactive computer experiments, based on virtual reality systems, in the context of measuring activity-scheduling behavior • Observed travel patterns are the result of underlying activity scheduling decision processes
….in other words • Measure how accurate individuals are able to recall and retrieve every day memories, and in particular, data about the travel behavior • In the new media: virtual reality
Research Design • Compare the existing methods of data collection (diaries / questionnaires) against a benchmark (reality) • Compare the new methods of data collection (virtual reality experiments) against a benchmark (reality) • Compare accuracy levels between the above methods
The Process - 1 • The process consists of three parts. • The first part entails recording “reality” benchmark • the Investigator “observes a Respondent carry out his/her activities at a distance without detection” • The second part requires the same Respondent to fill out a Questionnaire,
The Process - 2 • The third part involves travel in a virtual environment that mimics the Schedule of the Subject of the day and period that s/he was observed
Tasks in Virtual Travel • A Respondent will be requested to recall and retrieve information about the schedule that was carried out during the period previously recorded by the Investigator • The subject will be requested to provide information about the nature of each activity and in the sequence as carried out.
Choice of VR Technology • Text based worlds • 3D Model • Panorama’s
Making of the Stereo Panorama’s • Rotating double cameras fitted with fisheye lens • Retouching • Stitching • Stereo correction
Data Analysis • Ongoing • Some preliminary observations of PAPI versus Observed • >50% of respondents report less number of activities than observed (benchmark) • 2% report conduct of activities different from that of observed • 50% of activity duration are over reported • 50% of travel time is under reported
Interactions between Pedestrian and City B. de Vries J. Dijkstra
Architects and urban planners are often faced with the problem to assess how their design or planning decisions will affect the behavior of individuals. Introduction Motivation Network model Multi-agent model Simulation model Discussion • One way of addressing this problem is the use of models simulating the navigation of users in buildings and urban environments. A Multi-Agent System based on Cellular Automata
Develop a model how pedestrian moves in a built and/or urban environment. • Pedestrians are represented by agents (actors). • The cellular automata model is used to simulate their behavior across the network. Introduction Motivation Network model Multi-agent model Simulation model Discussion • Multi agent technology based on cellular automata can be used to develop a model how actors move around in a 2D or 3D environment. The 3D environment is a virtual reality based environment design. • A simulation model would allow the designer to assess how design decisions influence pedestrian activity/movement and hence performance indicators.
Important issues • Actors navigate in a virtual built/urban environment, each with their own behavior, beliefs and intentions • They perceive their environment and show some behavior according certain rules • Practical experience from visits in the past • Activity agenda Introduction Motivation Network model Multi-agent model Simulation model Discussion • The simulation model, as a decision support tool could be very useful to apply possible modifications to the design concept - AMANDA
The network is the three-dimensional cellular automata model representation of a state at a certain time. v = 2 cells / t
Introduction Motivation Network model Multi-agent model Simulation model Discussion Agent Model
User Agent Introduction Motivation Network model Multi-agent model Simulation model Discussion Define an user-agent as: U = < R | S >, where: • R is finite set of role identifiers: {actor, subject} • S represents the scenario each user-agent i possesses and includes • Personal characteristics • Agenda • Behavioral principles • Cognitive map • Time budget
Point of Departure Introduction Motivation Network model Multi-agent model Simulation model Discussion • Design of a simulation experiment of pedestrian movement • Considering a (T-junction) walkway where pedestrians will be randomly created at one of the entrances.
Introduction Motivation Network model Multi-agent model Simulation model Discussion Movement rules
Introduction Motivation Network model Multi-agent model Simulation model Discussion
Introduction Motivation Network model Multi-agent model Simulation model Discussion
Introduction Motivation Network model Multi-agent model Simulation model Discussion For example: We will get more insight into the influence that store layouts have on consumer circulation patterns and shopping behavior in retail environments.
Interactions between Designer and City B. de Vries V. Tabak
Mass Modeling on the Urban Scale • Relevance • The system • DDDoolz • VISTA
Strengths Quick No restrictions Simple Abstract Weaknesses Inaccurate Error prone Chaotic Redundancy Traditional: Sketch + Scale Model
Computers in the early design stage Strength: Visualisation andCommunication Weakness: Too accurate and too complex
Building blocks Programme • Requirements: • Living – Labour • Open spacesHouses: approx. 250 Living(12x7x3) Labour(6x7x3) Urban plan 3D model
Basic Principle Drag and Copy
Edge Drag Extrude Intrude
StrokeRepersentation of greens, roads, etc. • Roof shapesShapes on top of blocks • GroupCollection of objects Block Stroke Group Roofshape Objects • BlockBasic shape with a specific function.
Manipulations • MoveSelect object and transfer. • StretchSelect object and extend in one direction. • RotateSelect object and rotate around one axis • DeleteClick on waste bastket of selected object.