Download

1 / 19
190 likes | 326 Vues
Recent Improvement of Integrated Observation Systems in Japan. WMO Technical Conference on Meteorological and Environmental Instruments and Methods of Observation TECO-2010 Helsinki, Finland, 31 August 2010. Kenji AKAEDA Observations Division, Observations Department JMA.

E N D
Recent Improvement of Integrated Observation Systemsin Japan WMO Technical Conference on Meteorological and Environmental Instruments and Methods of Observation TECO-2010 Helsinki, Finland, 31 August 2010 Kenji AKAEDA Observations Division, Observations Department JMA
Precipitation at Nagoya, 2000 1 hour precipitation accumulation Severe Weather in JAPAN - torrential downpour / typhoon - Violent Wind Recent Disaster Distribution (1998-2004) Landslide Flood
Overview of the Observational Systems in JMA Upper-airObservations GPSObservation Surface Observation Meteorological Satellite Weather Radar Lightning Monitoring JMA Disaster managers TV stations private weather associations the nation Weather forecast Advisory Warning etc. Doppler Lidar
Surface Observation Network Observatories156 〇,+, 〇 AWS1042 (〇 rainfall, temperature, wind, sunshine 476) (+ rainfall, temperature, wind, sunshine,snowfall 210) (〇 rainfall356) Each stations locate in intervals of about 17km. Center System (JMA Headquarters) every 10sec every 10min Observatory AWS Upgrade to observe maximum instantaneous wind speed to monitor typhoon or gusty wind Automated Weather Station
Observatories (unmanned) Observatories AWS QC / HK QC / HK QC / HK JMA Headquarters (Tokyo) Data statistics/archive system Data collection/processing system Web Server observations entered manually (visibility, weather, etc) data archive data statistics Data Collection Server QC /QA(non-real-time) spatial consistency, time-series consistency, climate range checks Data Sharing/Storage Server CLIMAT data dissemination QC / QA(real-time) numeric ranges, intra-consistency checks, to add the quality flag to the datum data processing SYNOP BUFR data dissemination (Publication, CD-ROM, Internet, etc) JMA users JMA Computer System for Meteorological Services Public GTS Users Users (Organizations, NMHSs)
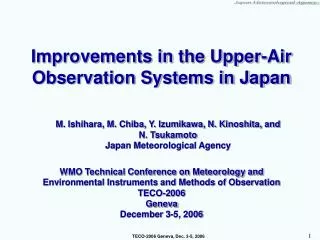
Upper-air Observation Network 16 (Average interval = 350km) 31 (Average interval = 110km) Kushiro GPS Radiosonde(16) Matsue Wind Profiler (31) Automatic Balloon Launcher (8)
Data Flow in Soundings of JMA ABLsites SHIONOMISAKI MATSUE NAZE HACHIJYOUJIMA MINAMIDAITO JIMA WAJIMA Ishigakijima To JMA HQ ・Sounding data ・Status data ToSites ・Control command KUSHIRO For numerical weather prediction models AtCONTROLCENTER ・Quality control of data ・Remote-controlling of ABL. CONTROL CENTER (JMA HQ) Global Telecommunication System DATA Forecast Made for each models MBLsites For weather watches Mannedlaunchedsite DATA WEB Contents Data Strage WAKKNAI SAPPORO AKITA TATENO FUKUOKA KAGOSHIMA CHICHIJIMA MINAMI TORISIMA
Data flow and QC of Wind Profiler Radome Radome type Standard type CONTROL CENTER(JMA Headquarters) 40 N • QC • at site • ground clutter removal • spectrum width check • migrating bird removal • precipitation effect removal • at Center • quadric surface check • vertical shear check • manual check every 10min 30 N 130 E 140 E JMA is preparing WPR guidance material as IOM publication
Comparison of Rawinsonde and Wind Profiler Measurements Correlation of u- and v- component measurements for the wind profiler and the rawinsonde, both located at Hachijyojima in 2008. u-component: avg. -0.36m/s std. 2.13m/s v-component: avg. -0.02m/s std. 2.06m/s Differences between wind profiler and rawinsonde wind component measurements (N=7514).
GPS Precipitable Water Observation GEONET (GPS Earth Observation NETwork) AMeDAS (AWS) GEONET is comprised of about 1200 GPS observation sites installed by the Geographical Survey Institute, Japan. The main purpose of GEONET is observing crustal movement with earthquakes.
Impact of GPS precipitable water on NWP 3-hour cumulative rainfall predicted by JMA’s 5-km MSM
Radar Data Flow Hazardous wind occurrence probability up to next 1hour Tornado Nowcasting Radar Data Quality Assured 3-D Doppler Velocity Data Radar Data Control Center Radar Data Lightning activity up to next 1hour Radar Data Radar Data Quality Assured 3-D Reflectivity Data Lightning Nowcasting Rainfall intensity up to next 1 hour Every 5minutes Precipitaion Nowcasting Nationwide Radar Composite Map Straightforward extrapolation Every 30 minutes Radar-raingauge Composite Map Rainfall up to next 6 hours Short-term Precipitation Forecasting Rain gauge data by AWS Data assimilation using 4D-VAR Messocale Numerical Model Non-hydrostatic 5 km Model operated every 3 hours
Sample of Lightning and Tornado Nowcast After 1h Lightning Nowcast Current Situation After 1h Tornado Nowcast
Summary • Most of the observational systems are remotely monitored • and controled by central system and whole data are gathered • to the central system. • QC / QA is important and JMA combines several method to • keep data quality. • AWS improved to output maximum instantaneous wind speed. • All radiosonde systems are upgraded to GPS sonde. JMA • operates 8 ABL, HGS and 8 normal radiosonde system. • JMA has stably operated 31 WPR for 10 years. JMA is now • preparing WPR guidance material as IOM. • GPS precipitable water data are routinely used in NWP. • 16 radars out of 20 radars are upgraded to Doppler radar. • Doppler velocity data are utilized in NWP and monitoring • tornadoes. Radar data are also utilized for lightning and • tornado nowcasting.
Radiosonde Data Flow GPS satellite signal Radiosonde signal Surface observation data incorporated in the upper air report JMA Headquarters (Tokyo) Data Storage Server QC / QA (non-real-time) Ascentdata (PTU,Wind) Calculate of observation ( including quality control procedures such as gross error checks ) Data Statistics/Archive System QC / QA (non-real-time) Descentdata (PTU,Location) JMA Computer System for Meteorological Services A/N Report (for domestic use) CLIMAT TEMP TEMPmessage GTS Radiosonde stations (16) Users
Example of migrating-birds echo Fukui (47616) 19 NOV 2002 Height (km) wind Time (JST) Wind Profiler in JMA Time (JST)
Wind Profiler Data Flow Profiler-3 Profiler-30 Profiler-2 10 minute values of Doppler velocity and signal intensity being sent every 10 minutes Profiler-1 Profiler-31 WINDAS Data quality control and remote control of profilers being made CONTROL CENTER(JMA Headquarters) Horizontal and vertical components of wind and signal intensity being sent with BUFR code every 1 hour C O S M E T S (JMA Central Computer) ADESS N A P S 10 minute data being sent every 1 hour Every1 hour Every 1 hour Forecast made with Meso-scale model Hourly analysis made with Meso-scale model Wind profiler data GTS
Nationwide Radar Composite Map Composite Processing Low-Altitude reflectivity of each Radar Z-R Conversion (Z=200B1.6) Radar-AMeDAS Processing Quality Control Calibration Factor of each Radar Calibration Combining (Maximum) Nationwide Radar Echo Composite Data