Download
1 / 22
240 likes | 522 Vues
Benefits and Risks of Fracking. Benefits Use of shale gas instead of coal for power production reduces CO 2 emissions Shale gas lowers energy cost; makes US companies more competitive Reduces crude oil imports; increases national energy security

E N D
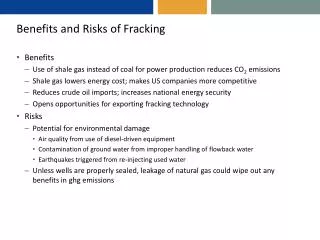
Benefits and Risks of Fracking • Benefits • Use of shale gas instead of coal for power production reduces CO2 emissions • Shale gas lowers energy cost; makes US companies more competitive • Reduces crude oil imports; increases national energy security • Opens opportunities for exporting fracking technology • Risks • Potential for environmental damage • Air quality from use of diesel-driven equipment • Contamination of ground water from improper handling of flowback water • Earthquakes triggered from re-injecting used water • Unless wells are properly sealed, leakage of natural gas could wipe out any benefits in ghg emissions
The Sun Offers 23,000 CMO/yrAnd we are looking for just a few CMO per year, but…
Changes in Global Energy Mix Have Occurred BeforeTransitions take scores of years
Why So Long to Get to Scale?Many roadblocks along the way • Expansion slowed by • Inertia of the incumbent system (sheer size) • Market acceptability (cost) • Infrastructure requirements • Lack of trained personnel • NIMBY, NOPE, and BANANA* • More rapid penetration possible when aided by • Strategic importance to military • High-value products for niche markets Jimmy Margulies, The Record, New Jersey, 2006 * Not in my backyard Not on planet earth Build absolutely nothing, anywhere near anything!
Producing 1 CMO Per Year from Various SourcesEnormous task requiring trillions of dollars • Hydro: 200 dams • 1 every quarter for 50 years • 18 GW with 50% availability (3 Gorges Dam) • Nuclear: 2,500 plants • 1 a week for 50 years • 900 MW with 90% av. • Solar CSP: 7,700 solar parks • 3 a week for 50 years • 900 MW with 25% av. • Windmills: 3 million • 1200 a week for 50 years • 1.65 MW with 35% av. • Solar Roofs:4.2 billion • 250k roofs a day for 50 years • 2.1 kW with 20% av.
What About Greenhouse Gas Emissions? • Differentiated response • Societies at different stages of development will make different choices • Focus on items that can make the most impact • Minimize natural gas emissions • Replace wood burning with natural gas or LPG: it improves quality of life and reduces GHG emissions • Fewer “Black Carbon” emissions, and • Maintains natural forests • Reduce red-meat from diet • Improve efficiency of fertilizer use: its a two-fer • Cuts energy use in fertilizer production • Reduces water pollution and subsequent NOx emissions • Focus on gallons consumed; not miles per gallon • Promote mass-transit and car-pooling
What Is the Path Forward?Innovation is needed on all fronts to meet future energy demand • Reducing demand from 9 to 6 CMO will be a major international effort requiring new technologies • Our planning cycle needs to • Last for 40 years not four • Transcend the prevailing price of oil • We need a family of innovations • Short term: efficiency, conservation, CSP, nuclear, public education • Intermediate term: Unconventional hydrocarbons, new engines, biofuels, electrify transportation • Long term: Thin-film PV, nuclear fusion,??? • “AND” is the operative conjunction • To make an impact, we need all technology options: • Efficiency AND conservation, AND nuclear AND solar AND wind AND…
Thank You Don’t waste Be informed Get involved cmo-ripu.blogspot.com
Nuclear PowerAn option we cannot ignore • Opportunity • Established scalable technology • Low footprint • Ample reserves • Risks • Fears • Radiation Exposure • Explosions • Political Challenges • Nuclear proliferation • Terrorism • Technical • Long-term storage • Cost (in part fed by fears) • Nuclear fusion, if realized, would ameliorate these risks
Questions to Consider • Does the source have CMO-scale potential to supply energy? • What infrastructure is required for large-scale CMO use? • Is it plug-and-play? • New pipelines and transmission structure? • What is its environmental footprint? • Energy return on fossil energy invested? • Competing land use issues? • Biodiversity, habitat destruction? • Can it compete with oil at $50/bbl, the cost of producing deep oil? • If not today, in the foreseeable future? • Competition for green energy comes from cheap fossil sources, not other green sources
Direct SolarStorage systems are needed • Cost • PV about 35 cents/kWh • Concentrating Solar Power competitively priced • Intermittency • Reduces availability to 20% • Need > 4 times the installed capacity • Location • Solar homes and offices (PV): close to use, but not enough • Utility scale systems: remote from population centers • Electricity transmission limited to < 1000 km
Wind PowerRuns up against NIMBY • Pluses • Huge potential: several CMO per year • Relatively low cost • Minuses • Intermittent: 25-30% availability; needs gas backup and/or storage • Dilute: 8-10 MW/sq. mile • Whose land? Habitat? • Often remote from energy consuming centers
BiomassThe only renewable that produces storable fuel • Lots of hope and hype • Global potential: 0.5 to 2 CMO • May not reduce greenhouse gases • Some options release more greenhouse gases than direct use of fossil fuels • Can strain water supplies • Can disrupt food supply and result in undesirable land-use practices
Residential and Commercial BuildingsLow-cost options abound • Consumes about 51% of primary energy • 39% in operations: HVAC, lighting, appliances • 12% in materials: steel, concrete, glass, sheetrock • Energy saving practices can pay off • Better insulation, efficient lighting, efficient heating • Smart grid • Allows for added savings and increased use of wind and solar sources • Green construction materials Commercial Residential
The Cost ChallengeMeeting the Chindia Price • Opportunity in developed countries • Over $500 billion in renovations in the US • Impact of adopting green practices is ~0.1 CMO/yr • Bigger opportunity in developing nations • New construction equivalent to the entire US is projected for China/India over the next 10 years • Several trillion dollars • Potential impact of adopting green practices • Ca. 2 CMO/yr • Cost of using green materials in construction is prohibitive CHINDIA • Major innovations needed to produce cost effective solutions
Efficiency and ConservationLow-hanging fruit • Efficiency: Using less energy to do what we do • Easiest and most economical path • Does not go all the way • Historically, we end up increasing total consumption! • Conservation: Avoid what we need not do • Tough to change lifestyles • Switch to high-density urban living and mass transit anyone? Vegetarian diet? • Can have a substantial impact 1 CMO ≅ 100 billion CFLs!
How Much Oil, Gas, and Coal Do We Have Left?We have plenty of fossil fuels, but mostly in unconventional sources Oil Gas Coal Reserves 46 42 66 AdditionalResource 94 AdditionalResource • 120 • Reserves • 1500 • Additional Resource • 400Unconventional • Tar sands, oil shales • 5,000 • Unconventional • Gas hydrates Their continued use increases atmospheric CO2 levels They will be needed while we switch to other sources
Global Oil Resources (cmo) 1,330 (50/70) (1.1/5.7) (2.8/5.8) 407 (15/45) (Schlumberger Business Consulting) cmo = cubic mile of oil
CMO: Cubic Mile of Oil EquivalentA unit appropriate for global energy flows • 1 CMO ≅ 1.1 trillion gallons of oil26 Billion (109) bbl oil • 1 CMO ≅ current annual worldwide oil consumption • 1 CMO is equivalent to: • 153 Quadrillion (1015) Btu (Quads) • 6.4 Billion (109) tons of hard coal • 15.3 Trillion (1012) kWh electricity (At 10,000 Btu/kWh; not 3412 Btu/kWh) 1 Btu ≅ the energy from a burning match 8 hours of cardio ≅ 1kWh ≅ 0.1 gal of oil
Where Is Energy Produced and Consumed?Asia Pacific and North America producemore energy than the Middle East Region; they also consumemore! 1.0 Hydropower Nuclear Power 0.9 Coal 0.8 Gas Oil 0.7 0.6 0.5 CMO 0.4 0.3 0.2 0.1 0 North America Central/South America Europe Russian Group Asian/Pacific Middle East/ North Africa Sub-Saharan Africa
Carbon Tracker: “Unburnable” carbonAre governments serious about climate change? Are governments serious about meeting MDGs?