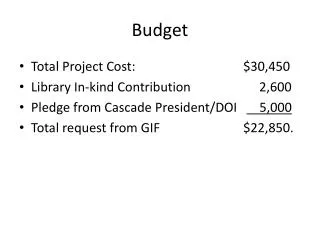
Budget
Budget. Here we explore the combinations of income and leisure the individual can obtain. Budget constraint. The budget constraint for an individual shows combinations of income and leisure that can be attained.

Budget
E N D
Presentation Transcript
Budget Here we explore the combinations of income and leisure the individual can obtain
Budget constraint • The budget constraint for an individual shows combinations of income and leisure that can be attained. • The constraint will be a line in a diagram where we put the hours of leisure on the horizontal axis and income on the vertical axis. When an individual takes more leisure here we are assuming that less time is spent as labor.
Budget constraint This budget line is drawn assuming the wage rate is $1. In one day, one could have 24 hours of leisure and no income, or no leisure and $24 income, or any other combo on the line. income (0, 24) leisure (24, 0)
Budget constraint income Note how the slope of the budget line is the negative of the wage rate. For every unit of leisure given up, $1 would be earned as income. slope=(change in inc) (change in leis.) =1/-1= -1 = -wage. (0, 24) leisure (24, 0)
(0, 48) Budget constraint income If the wage should rise, to say $2 per hour, the budget constraint rotates clockwise. The point on the vertical axis now has to indicate $48 in income if one worked all day. The slope of the new budget is - $2. (0, 24) leisure (24, 0)
Budget constraint income (0, 24) nonlabor income leisure (24, 0) If the individual has nonlabor income, the budget line shifts up by the amount of nonlabor income. The slope remains as was - remember the slope is the negative of the wage rate.
Let’s come up with the equation for the budget constraint. The dollar volume of income – y - we can undertake is made up of our income from work and any nonlabor income we have. If the wage is w, h is the number of hours we work, and the nonlabor income is Z, then y = wh + Z.
y = wh + Z Say T = 24 hour day, then the amount spent in work is 24 minus the time spent in leisure (l). So, y = w(24-l) + Z Note: 1) If l=0, meaning all time is spent working, y = 24w + Z. 2) If l = 24, meaning all time spent in leisure, y = Z. 3) If Z = 0, meaning no nonlabor income, y = w(24-l)
Note here that when the nonlabor income changed the budget shifted out in a parallel fashion.
The budget line represents the most of income and leisure the individual can get. The individual can be inside the budget, but not outside it (meaning farther out in the northeast direction from the budget.) Next we will bring together the budget line and the indifference map for an individual and explore what the connection is between the two.