Download
1 / 35
350 likes | 451 Vues
Learn about the sources, classification, and health effects of particulate matter (PM) in this informative guide. Discover how PM10 and PM2.5 affect respiratory health and mortality rates. Explore air quality objectives, pollution indexes, and findings from a comprehensive review by Dr. Christopher Johnson. Gain insights into emission levels from Hanson Cement and air quality statistics in Wales and the UK.

E N D
Introduction to particulate matter Dr David Russell Unit Head Centre for Radiation, Chemical and Environmental Hazards (Wales)
Contents 1 – Introduction to particulates 2 – Particulates and health 3 – Air Quality Objective 4 – Air Pollution Index 5 – Findings of Review of Particulate Matter Report (Dr C Johnson)
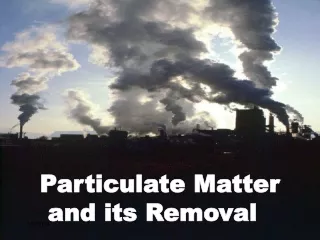
Particulate MatterPM Particles are produced from a variety of natural and man made sources. • Natural sources include sea salt, wild fires, volcanic activity, Saharan sand. • Man-made sources include road traffic (brake dust, exhausts, road salt), bonfires, industrial activity
Particulate matter is generally classified by particle size PM10 – i.e. Particulate Matter of less than 10 millionths of a metre (10 micrometers or 10mm) in diameter. In general particles in this size range are not visible to the naked eye. PM2.5 –this is a subset of PM10 and relates to Particulate Matter of less the 2.5 millionths of a metre (2.5mm) in diameter. in ambient air PM2.5 fraction approx. 70% of total PM10
Particulates and Health Acute exposure to PM10 associated with increases in: • number of hospital admissions for respiratory disease patients • increases in reported symptoms among asthmatic patients. i.e increased risk for those already susceptible. Increases in all cause, cardiopulmonary and lung cancer mortality linked to chronic exposure to PM2.5. Long term effects are more strongly linked to PM2.5 than PM10 and therefore PM2.5 of greater public health concern
Air Quality Objective Set by Air Quality Regulations 2010 • Annual mean concentration should be no more than 40mg m3. • 24 hour mean concentration (max 50 mg m3) is exceeded on no more than 35 occasions per year. • annual mean concentration of PM2.5 particles of less than 25 mg m3 by 2010 with this becoming a legal limit by 2015. Particulate matter is ubiquitous from natural and man-made sources therefore the objective represents a balance between protection of vulnerable populations and levels which are as low as practicable.
Air Pollution Index Approved by UK Committee On Medical Effects of Air Pollution (COMEAP) for describing acute impact of particulate matter pollution
Review of Particulate Matter(Air Quality and Emissions Data) Dr Christopher Johnson Senior Environmental Scientist Centre for Radiation, Chemical and Environmental Hazards (Wales)
Contents • Methodology • UK and Regional Background • Point Source Emissions from Padeswood Cement Works • General Air Quality • Directional Analysis • Specific Air Quality Events • Conclusions
Methodology(Data Collection) • Particulate data acquired from a number of positions around Hanson Cement from 2004-2009 15 minute average data • Environment Agency (2005-2007) – Penyfordd • Hanson Cement (2004 – 2009) - Penyfordd • Local Authority (2008-2009) – Mold • Emission Watch (2005-2009) – Various 1hr Average data • DEFRA (2007) – Wrexham 24hr Average data • DEFRA(2002-2009) - Wrexham
Methodology(General Statistics) General air quality statistics calculated: • Annual mean • 24hr Midnight to Midnight mean for comparison with Air Quality objectives • 24hr Running mean for comparison with Air Pollution Index • Directional analysis based on meteorological data collected Events for further analysis were selected based on: • Complaints • Reportable Events • Air Qualty
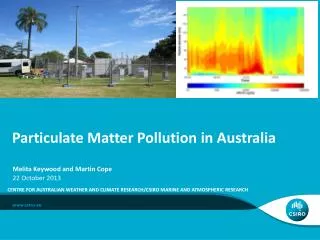
BackgroundUK PM10 and PM2.5 PM2.5 – 2006 2010 Over study period a general reduction in PM10 and PM2.5 concentrations are seen across the UK.
BackgroundRegional PM10 2004 2010 8.01 – 10.0 ug m3 10.01 – 12.0 ug m3 12.01 - 14.0 ug m3 14.01 – 16.0 ug m3 16.01 – 18.0ug m3 18.01 – 20.0 ug m3 >20 ugm3
Emissions from Hanson Cement Environmental Permits set limits for emissions of particulates from point sources at the site Two aspects to examining emissions What are the limits? How much is actually being emitted?
Emissions from Hanson Cement Permitted emissions reduced since 1999
Total Emissions from point sources Total Annual Point Source Emissions from Hanson Cement Works
Point Source Emissions in Context Compared to other emitters • Ranked 4th in Flintshire (<9% of total) • Ranked 9th in 15 mile radius (<2%) <1 Tonne pa 1-5 Tonnes pa 5-10 Tonnes pa 10-15 Tonnes pa 15-20 Tonnes pa >20 Tonnes pa
General Air Quality • Well below Air Quality Objective annual mean 40ug m3 • No recorded exceedance of AQO Decrease in annual PM10 concentrations in line with predicted national trends Generally good agreement between monitoring positions
Air Quality in Wales Air quality similar to rural AURN station at Narberth (Pembrokeshire) Lower than most Urban stations in Wales
General Air QualityKey Points General air quality is good and has been improving. • Improvements in particulate pollution are in line with UK trends • Air quality is in line with expectations from background modelling • Air quality is better than areas in South Wales where particulate monitoring occurs
Directional Analysis EA- Mobile Monitoring Facility 2005/6 – PM10 Evidence that there is a source of coarse particles (>PM2.5) in direction of Hanson Cement is measureable in Penyfordd. Main contributor to PM2.5 concentrations are strong easterly winds. This is in line with UK trend EA- MMF 2005/6 – PM2.5
Directional AnalysisKey Points Some evidence that of course particles source in direction of Hanson Cement affecting Penyfordd. • Source is not a major contributor of smaller particles <PM2.5 • No clear evidence of this source at other sites • Magnitude of source reducing over time Elevated PM2.5 particles associated with Easterly winds at all sites • Related to particulates in long range transport from continental Europe
Specific Air Quality Events Criteria used to select events highlighted 95 individual events that fitted criteria for further analysis • Complaints frequency (13) • Part A Incidents (21) • Top 5 peaks per monitor per year (44) • Air pollution index (17)
Issues identified Analysis identified three issues common issues • Night time increases in particulate concentrations in Penyfordd • Very high particulate peaks South of Buckley • Monitoring discrepancies
Night time peaks at Penyfordd • high correlation between time and peak occurrence in Penyfordd • 8hr average concentrations in Penyfordd are higher at night. • pattern not evident at other monitors • high concentrations associated with a drop in wind speed. • no difference if kiln shutdown or operational
Night time peaks in Penyfordd Possibly due to inversion layer?
Night time peaks in Penyfordd Key Points Evidence of a phenomenon that is not fully understood Magnitude of peaks not sufficient to cause concern based on air quality standard Highest concentrations are in evening or night when people are outside less No evidence cement kiln is a major contributor to peaks
Peaks near Buckley 57 similar events characterised by • Peak with very large PM10 concentration • PM2.5 concentration also increases • occur over broad range of wind direction • evenly distributed with wind speed
Peaks near Buckley Key Points The peaks identified are of significant magnitude to cause acute effects for exposed individuals. Majority of occurrence is during the daytime when exposure is most likely. There is evidence that Hanson Cement is not the cause or even a major contributor to these events.
Monitoring discrepancies In general extremely good correlation between monitors
Monitoring discrepancies March 2006-Sept 2008 Underreporting of ambient concentrations at operators monitoring station in Penyfordd Errors may continue until end of 2009
Monitoring discrepanciesKey Points Errors in ambient monitoring results from the operator did exist and these have been raised with the regulator. No reliable data could be obtained for this review after March 2006 from the Hanson Cement monitor. Emission Watch monitors, DEFRA, and the EA-MMF provide a consistent and reassuring picture of air quality over the period and allow confidence in the report conclusions.
Conclusions Air quality around Hanson Cement: • is good • is in line with expectations. • is improving Emissions from the plant: • have reduced over study period (2000-2009) • are <2% of point source emissions within 15 miles of the plant
Public Health Conclusion Over the study period the impact on health from exposure to particulates from all sources in the area are likely to have decreased. Increases in concentrations of PM2.5 particles (i.e. those that give most concern for long term health impact) are associated with national not local phenomenon. None of the evidence examined suggests that particle concentrations locally are likely to pose a special risk to health.