Download
1 / 19
190 likes | 284 Vues
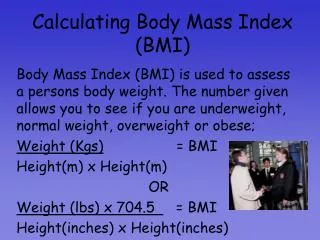
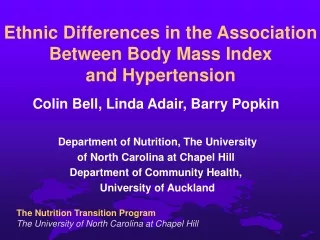
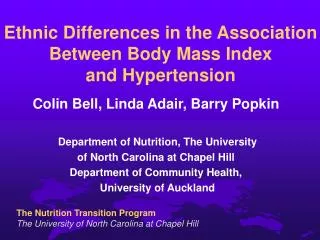
Investigating ethnic variations in the correlation between BMI and hypertension in men and women aged 30-65, using data from Chinese, Filipino, and US populations. Results suggest potential differences in the impact of BMI on hypertension among different ethnic groups.

E N D
Colin Bell, Linda Adair, Barry Popkin Department of Nutrition, The University of North Carolina at Chapel Hill Department of Community Health, University of Auckland Ethnic Differences in the Association Between Body Mass Index and Hypertension
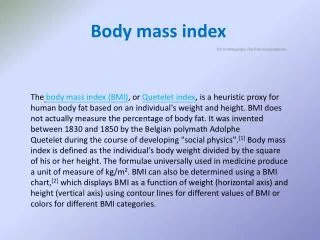
Does a BMI of 25 kg/m2 mean the same thing in different populations? • BMI is only an approximate measure of body fatness • Good evidence exists that some populations have different levels of body fat at similar BMIs • Asian: smaller frames, higher % body fat than Caucasians (Deurenberg et al, Int J Obesity 1998,1999) • Polynesians: larger frames, more lean body mass, lower % body fat than Caucasians (Swinburn et al, Int J Obesity 1999)
If body fat differs, do obesity related co-morbidities also differ? • In Hong Kong Chinese, Ko et al observed increased prevalence of type-2 diabetes, hypertension, dislipidaemia and albuminuria at a BMI of ~ 23 kg/m2 (Ko et al, Int J Obesity 1999) • In Polynesian populations serum lipids tend to be lower than for Caucasians in spite of higher BMIs (Bell et al, NZ Med J 2001, Scragg et al, NZ Med J 1993) • However: • direct comparisons are needed in a variety of ethnic groups
Objective • To determine whether there are ethnic differences in the association between BMI and hypertension in men and women aged 30 - 65 years Ethnicgroups • 3,423 Chinese men and women (CHNS 1997) • 1,929 Filipino women (CLHNS 1998) • 7,957 non-Hispanic Whites, non-Hispanic Blacks, Mexican Americans (NHANES III 1988 - 1994)
Methodology • Pooled cross-sectional data from three surveys • Outcome = Hypertension • SBP 140 mm Hg , DBP 90 mm Hg, or on anti-hypertension medication • Including those on medication biased the result towards the null or had no effect (see following figure) • Main explanatory variable = BMI • Confounders = Age. Physical activity, smoking and alcohol consumption were not major confounders. (see following figure)
We included pre-diagnoased individuals to boost cell size and because their inclusion biased the results towards the null
Physical activity, smoking status and alcohol consumption had a minimal effect on the association between hypertension and BMI in all ethnic groups: eg NHBlack women
Compared to US ethnic groups, Chinese men & women were less hypertensive; Filipino women had similar levels of hypertension to NHWhites
Compared to US ethnic groups, Chinese men & women & Filipino women were less overweight (BMI 25 kg/m2)
Chinese men had higher odds of prevalent hypertension, adjusted for age, than NH-Whites at every category of BMI, including 23-24.9 kg/m2
Including waist circumference attenuated the association for both Chinese & NHWhite men but the ethnic differences remained
The age-adjusted odds of prevalent hypertension for Chinese and Filipino women were similar to those for NH-Whites at low levels of BMI
Two problems can arise when using odds ratios in this context • Odds ratios are dependent on a reasonable number of subjects in the reference category • Interpretation can be misleading because the analysis assumes that the underlying risk (or in this case prevalence) between the ethnic groups is the same
Subject numbers were sufficient but hypertension prevalence differed markedly by ethnic group in the referent BMI category (BMI 18.5-22.9 kg/m2)
To overcome this problem, we used prevalence difference figures. A steeper slope was observed at low levels of BMI for Chinese men (10.8% ) compared to NHWhite men (1.8% )
There was also some evidence of a steeper slope at low levels of BMI for Chinese women (7.6% ) compared to NHWhite women (4.3% ). Filipino women showed a 10.3% between the categories 23.0-24.9 and 25.0-26.9 kg/m2
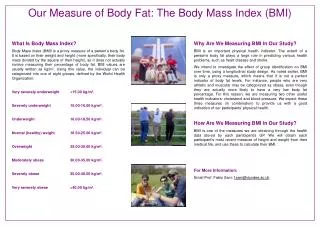
Current WHO weight status recommendations for Asia and the USA
Should lower definitions of overweight and obesity be used for Asian populations? • We have shown some evidence that the association between hypertension and BMI may be stronger in Chinese compared to NHWhites • There was no evidence of a stronger association for Filipino women, however, a higher baseline prevalence may justify a lower cut-off • To fully justify lower cut-offs we need longitudinal studies, data on all co-morbidities, consensus on appropriate methodology and more specific definitions of ethnicity
The value of ethnic-specific BMI cut-offs? At the clinical level: • In countries such as the USA, with considerable ethnic diversity, physicians would be better able to identify individuals at risk of obesity related co-morbidities At an international level: • At this level, the utility of a weight classification system is in the ability to compare populations and monitor changes overtime & therefore there is no advantage in having ethnic-specific cut-offs