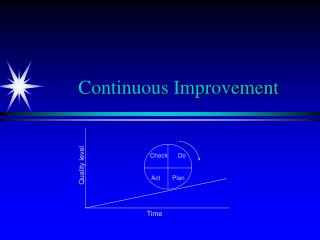
Using Data f or Continuous School Improvement
Using Data f or Continuous School Improvement. 2014 Fall CIP Workshops. 4 Types of Data. Type : Demographic Who are we?. Type : Perceptions How do we do business?. Type : School Processes What are our processes?. Type : Student Learning How are our students doing?. Goal 2 SLDS Grant.

Using Data f or Continuous School Improvement
E N D
Presentation Transcript
Using Data for Continuous School Improvement 2014 FallCIP Workshops
4 Types of Data Type: Demographic Who are we? Type: Perceptions How do we do business? Type: School Processes What are our processes? Type: Student Learning How are our students doing?
Goal 2 SLDS Grant Provide a statewide system of professional development training for data analysis that reaches every district. Tiered Training Delivery ✔ School District Staff School District Leadership ESUs and NDE Staff ✔ Statewide Data Cadre ✔
Statewide Data Cadre • Higher Ed • Dick Meyer – UNK • ESUs/ESUCC • Rhonda Jindra – ESU 1 • Mike Danahy – ESU 2 • Marilou Jasnoch – ESU 3 • Annette Weise – ESU 5 • Lenny VerMaas – ESU 6 • Denise O’Brien – ESU 10 • Melissa Engel – ESU 16 • Jeff McQuistan – ESU 17 • NDE • Data, Research, Evaluation • Russ Masco • Matt Heusman • Rachael LaBounty • Kathy Vetter • Assessment • John Moon • Federal Programs • Beth Zillig • Special Education • Teresa Coontz • Curriculum • Cory Epler • Tricia Parker-Siemers • Accreditation and School Improvement • Don Loseke • Sue Anderson
Nebraska Data Literacies What do the data show? Why might this be? How should we respond? Did our response produce results? Data Comprehension Data Interpretation Data Use Evaluation
Data Literacies Format Literacy 1. Concept a. Indicators i.
Data Literacies http://www.education.ne.gov/DataServices/SLDS_Grant/Data_Literacies.pdf
Data Use Curriculum Nebraska Data Literacies
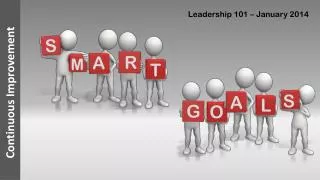
AGENDA • WHY data analysis/continuous school improvement? • WHAT process/data do we need to engage for school improvement? • HOW do we involve all staff in the process of school improvement? Tools and resources…
Bernhardt, V.L. (2013) Data Analysis for Continuous School Improvement (Third Edition) New York, NY: Routledge
BACKGROUND • Education for the Future – Non-Profit Initiative • Victoria L. Bernhardt, Exec Director • California State University, Chico • Our Mission • Funded by contracts. • 17 Books, Conferences, Institutes, Workshop. • Manage long-term implementation contracts. • Monthly online meeting series.
Data Analysis for Continuous School Improvement, Third Edition, ……is about inspiring schools and districts to commit to a continuous school improvement framework that will result in improving teaching for every teacher, and improving learning for every student, in one year, through the comprehensive use of data. It is about providing a new definition of improvement, away from compliance, toward a commitment to excellence. P. 5
HOW MUCH TIME DOES IT TAKE? It will take one school year for a school staff to do all the work described in this book. If parts of the work are already done, a staff might still want to spread out the work throughout the year. P. 10
WHY Data Analysis/Continuous and School Improvement?
What would it take to ensurestudent learning atevery grade level, in every subject area, and with every student group?
WHAT IS THE HARDEST PARTFROM YOUR PERSPECTIVE? • Beliefs that all children can learn. • Schools honestly reviewing their data. • One vision. • One plan to implement the vision. • Curriculum, instructional strategies, and assessments clear and aligned to standards. • Staff collaboration and use of data related to standards implementation. • Staff professional development to work differently. • Rethinking current structures to avoid add-ons.
THINGS WE KNOW ABOUT DATA USE • For data to be used to impact classroom instruction, there must be structures in place, to— • implement a shared schoolwide vision. • help staff review data and discuss improving processes. • have regular, honest collaborationsthat cause learning.
Mission Vision Continuous Improvement Cycle
VISIONdefines the desired or intended future state of an organization or enterprise in terms of its fundamental objectives relative to key, core areas (curriculum, inst, assess, environ).
VISION • Curriculum— What we teach. • Instruction— How we teach the curriculum. • Assessment— How we assess learning. • Environment— How each person treats every other person.
MISSIONsuccinctly defines the fundamental purpose of an organization or an enterprise, describing why they exist.
Data Analysis for Continuous School Improvement Is About What You Are Evaluating Yourself Against
“In times of change, learners inherit the earth, while the learned find themselves beautifully equipped to deal with a world that no longer exists.” - Eric Hoffer
Page 14 Data Literacy 1 What do the data show? Where are we now? Data Literacy 2 Why might that be? How did we get to where we are? Data Literacy 2 Why might that be? Where do we want to be? Data Literacy 3 How should we respond? How are we going to get to where we want to be? Data Literacy 4 Did our response produce results? Is what we are doing making a difference?
Data Literacy 1 What do the data show?
Data Literacy 2 Why might that be?
Data Literacy 2 Why might that be?
Data Literacy 3 How should we respond?
Data Literacy 4 Did our response produce results?
IMPORTANT NOTES • Continuous School Improvement describes the work that schools do, linking the essential elements • Continuous School Improvement is a process of evidence, engagement, and artifacts
A PROCESS OF EVIDENCE, ENGAGEMENT, AND ARTIFACTS • Evidence: • Data to inform and drive a logical progression of next steps. • Engagement: • Bringing staff together to inform improvement through the use of data, moving from personality driven to systemic and systematic. • Artifacts: • The documentation of your improvement efforts.
Page 14 Data Literacy 1 What do the data show? Where are we now? Data Literacy 2 Why might that be? How did we get to where we are? Data Literacy 2 Why might that be? Where do we want to be? Data Literacy 3 How should we respond? How are we going to get to where we want to be? Data Literacy 4 Did our response produce results? Is what we are doing making a difference?
COMPLIANCE VERSUS COMMITMENT Page 4 Bernhardt, V.L. (2013). Data Analysis for Continuous School Improvement. Third Edition. New York, NY: Routledge. Page 4. Reproducible.
Data Literacy 1 What do the data show?
“Study the past if you would like to define the future.” - Confucius